GBPUSD Multi TF Analysis 28/5/2024SL - 1.27310
TP - 1.28705
1M price chasing up.
1W price in strong strength.
Channel up.
GBPUSD trade ideas

GBPUSD rallied early on TuesdayGBP/USD rallied early on Tuesday, briefly reaching its highest point since March 21, but gains were short-lived as sellers quickly pushed the pair down from the psychological 1.2800 level, driving it towards 1.2755. If this ceiling holds in the near term, bulls may start bailing, creating the right conditions for a move toward 1.2700. Further weakness could shift focus to 1.2635.
Conversely, if buyers manage to reclaim dominance in the coming days and take out resistance at 1.2800, the upward momentum could intensify, propelling GBP/USD towards 1.2895 – the March peak. While overcoming this ceiling might be difficult, it is still feasible. On that note, upside clearance of this barrier could result in a rally towards the 1.3000 handle.

GBPUSD: Market of Sellers
Looking at the chart of GBPUSD right now we are seeing some interesting price action on the lower timeframes. Thus a local move down seems to be quite likely.
❤️ Please, support our work with like & comment! ❤️

Elliott Wave Analysis Expects GBPUSD to Pullback in Wave 2Short Term Elliott Wave in GBPUSD suggests rally from 4.22.2024 low unfolded as a 5 waves impulse Elliott Wave structure. Up from 4.22.2024 low, wave ((i)) ended at 1.2635 and pullback in wave ((ii)) ended at 1.2445. The pair extends higher again in wave ((iii)) with internal subdivision as an impulse in lesser degree. The 1-hour chart below shows the subdivision of wave ((iii)).
Up from wave ((ii)), wave (i) ended at 1.2541 and dips in wave (ii) ended at 1.2502. GBPUSD then extended higher in wave (iii) towards 1.2726 and pullback in wave (iv) ended at 1.2685. Final leg wave (v) ended at 1.2761 which completed wave ((iii)). The pair then pullback in wave ((iv)) towards 1.2675 and extended higher in wave ((v)) to end at 1.2801 high completing wave 1 in higher degree. Near term, as far as pivot at 1.2801 high stays intact, expect dips to find support in 3, 7 or 11 swing pullbacks to end wave 2 correction before further upside.

GBPUSD head and shoulder setupIntraday Update: IF the PCE data today is hot, or we get a positive US dollar reaction, the GBPUSD is setting up a head and shoulder pattern. Neckline is at the 1.2667 level which is just about 50 pips away from current price.

GBP/USD Trading Analysis and RecommendationSell Opportunity:
An opportune moment for selling presents itself in the GBP/USD currency pair at the current rate of 1.27220, with promising potential for profit.
Targets:
Primary Target: 1.27000
Secondary Target: 1.26725
Breakout Scenario:
Should the pair surge beyond the resistance level of 1.27470, signaling a bullish breakout, the target price is envisaged to rise towards 1.27900.
Comprehensive technical analysis suggests a prevailing sentiment conducive to selling at the current market price.
Fundamental factors align with the proposed selling strategy, indicating downward pressure on the GBP/USD pair.
Implementation of robust risk management techniques is advised to mitigate exposure to potential adverse market fluctuations.
Disclaimer: This analysis is provided based on current market conditions and historical data. Traders are urged to conduct thorough research and exercise prudence, employing appropriate risk management strategies, before executing any trading decisions.

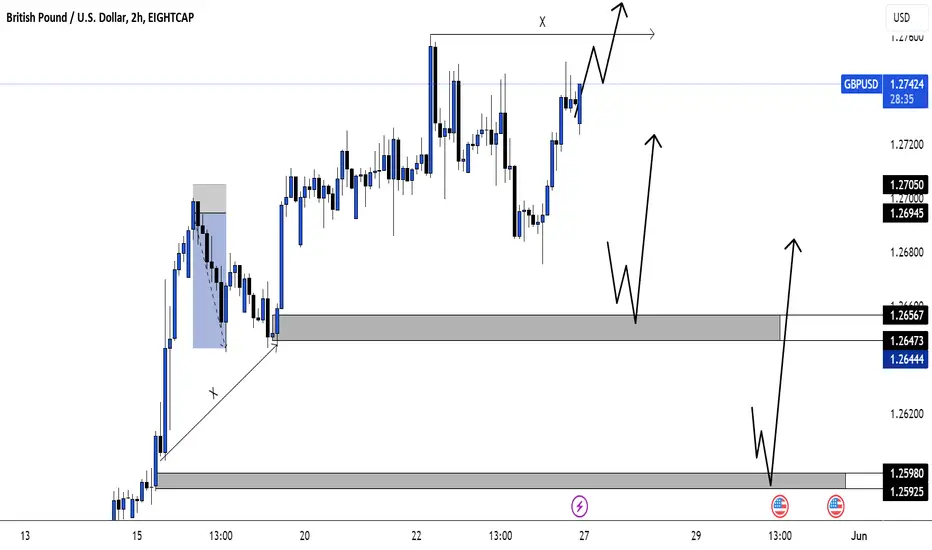
CHART BREAKDOWN GBPUSD: Key Levels, Targets and Thoughts!🎯Brief Description🖊️:
The chart provides insights into critical market levels, emphasizing an essential demand zone (low-risk buy zone) spanning from 1.26000 to 1.25900. Additionally, medium-risk buy zone between 1.26570-1.26470, respectively, are highlighted.
Things I Have Seen👀:
Important Demand Zone🟢: Identified between 1.26000 and 1.25900, serving as a low-risk buy.
Medium-Risk Buy Zone🟠: Noted between 1.26570 and 1.26470, suggesting another area with moderate risk for potential buying positions.
Bullish Targets📈:
1.26200: Possible retracement area.
1.26500: Possible retracement area.
1.26750: Significant supply zone.
1.27600: Liquidity area.
What's Important Now❗
Currently, the crucial approach is to wait and observe the price action at this level. We need to assess how the market reacts before considering any decisive moves. Stay observant and responsive to real-time developments in the market.
GBPUSD intraday selling strategyDear traders! On the 1-hour timeframe, we see GBPUSD confirm a drop below 1.2700 and reach 1.2686, after which the price quickly pulled back and retested liquidity amid a correction and sell-off. The price reaction to the established liquidity zone is consistent with our selling outlook. Expecting a more solid selling strategy, Conan is waiting for a drop to at least 1.2643. And you? Are you expecting a wave of GU discounts?

GBPUSD maintains gains above 1.2700Dear traders! As Conan predicted earlier, the GBP/USD pair remains well supported across the price channel amid hotter-than-expected UK CPI inflation data, reducing interest rate cut bets on June from the Bank of England. So the lack of change from yesterday's session above 1.2720 on Thursday and the consolidation above 1.2700 in time should not come as too much of a surprise.
Fundamentally, the outlook is positive. With this sustained high it is likely that the ideal swing zone of 1.2700 on the 2-hour time frame is likely to be tested for strong accumulation before strengthening further towards the psychological figure. 1.2800.

GBPUSD - Easy intraday or swing sellThere is a sell opportunity on GU because of USD strength
Fundamentals
Look out for USD news this week. If no shocking difference than forecast I don't see why DXY won't go up.
→ Prelim GDP q/q ( Thursday 28 May )
→ Unemployment Claims ( Thursday 28 May )
→ Core PCE Price Index m/m ( Friday 29 May )
Visit www.forexfactory.com or www.investing.com to check release time according to your timezone
Technicals GBPUSD
→ We rejected a major resistance zone which we touched multiple times since June 2023
→ We breached a 4H trendline
→ Daily engulfing bearish candle
Technicals DXY
→ We came into support and are heading up.
→ We do have a zone here which can act as resistance, but I expect that we will breach it.
→ We broke out of trendline and retested it and gone up.
Your trading friend,
Simba Trades

uptrend It is expected that the current corrective trend will end in the specified support ranges and we will see the beginning of the upward trend.
With the breaking of the support trend line, the continuation of the corrective trend will be possible

GBPUSD H4 BEARSTimeframe H4: Entry of bears in the market
during london session.
Timeframe H1: Possible support could be 1.2669.
Alternative view:
H4: A break above 1.2780 qualifies bulls continuation to the upside.

$GBP - What shall we do now?$GBP - What shall we do now?
GBP - Since we hit below 1.14 - 1.10 it's really been a one way for this pair and it could continue...However, we have options!
1 Emergency rate hike
2 Intervention
3 IMF
4 Fiscal spending
5 Swap Lines
Now these are the options technically speaking we filled gap around 1.09 this morning, I expected 1.06 on table during open we hit lows of 1.03... Now, if we can hold the levels of these levels and perhaps go above 1.09 then no worries. However, if we carry on with these moves then things will get very interesting and keep an eye on the Gilt & FTSE!
Now it all looks very dismal when it comes towards headlines but actually there are coming amazing investment opportunities the prices we are getting and of course if you're in USA, what a great time for you to visit! For Candle stick traders - dragon fly!
Keep alert of what happens next, this week we have a lot speakers out of CB's and most importantly trade your plan!
Best,
TJ

GBP-USD Will Grow! Buy!
Hello,Traders!
GBP-USD retested the
Horizontal support of 1.2688
And we are already seeing
A bullish rebound so
We will be expecting
A further move up
Buy!
Like, comment and subscribe to help us grow!
Check out other forecasts below too!

H4 Bearish Trend GBPUSDGBPUSD had HTF strong bearish trend which was confirmed by H4 ChoCh. Now the market has succeeded pullback to 75% Fibo level or 388 level of Fibo extension. My analysis, GU will continue the bearish trend & retest the unmitigated shadow on 24500-25000 level.
*disclaimer ON *DYOR

GBPUSD LONGOn last week's setup, Price pulled back to my entry on Friday of which I do not take new entries on Friday. Now following structure and moving forward, Therefore;
Market Structure is still bullish on HTFs
Potential entry at Daily AOi
Weekly Rejection from AOi
Bullish momentum on the weekly showing lots of buyers in the market
Daily Rejection at AOi
Around Psychological Level 1.27000
H4 Candlestick rejection Y
Possible EMA retest
Levels 4.96
Entry 70%
REMEMBER: Trading is a Game Of Probability
: Manage Your Risk
: Be Patient
: Every Moment Is Unique
: Rinse, Wash, Repeat!
: Stay Hydrated
#Follow#Share#Comment#Boost
Price likely to go higher and break my current Resistance level, Retest for further go long,
Looking to React to the market accordingly

Long GBP/USDA bearish OB has been disrespected, followed by a bull order block accompanied by a major Break Of Structure. This is reinforced by the respected Breaker Block that was formed by the original disrespected bearish Order Block. When price moved inside the BB, there was a bullish Order Block on the 15 minute chart, therefore my entry. I can also be certain there will be another Break Of Structure here. Feel free to comment your thoughts below :)

Cable moving into Daily trendline resistance near 1.28Cable has seen some nice recovery at the end of 2023; move is looking impulsive so more gains can be seen after the corrective retracement which has unfolded down from March highs. So far, price came down with three waves but pair is making a nice turn-up in last few weeks, out of a downward channel, thus it appears that pair is back in bullish mode. In fact, UK CPI figures reported last week indicated a cooling of inflation, but not as much as expected, so potential June cuts are most likely off the table. Looking at the 4h time frame, we see nice five subwaves up as expected which look like a wave 3, therefore we can expect much higher targets after a next pullback while market trades above 1.2570 invalidation level. However, there can be some resistance in the short-term, near the daily trendline that comes in around 1.28.
Support on dips is at 1.2650.

GBPUSDApproaching the sell area we will wait for set-up here but my entry is at 1.2770 for the bear to have a go....

What should GBPUSD today be traded?Hello everyone, Brian here!
Today, GBPUSD is trading around 1.69, continuing its decline from yesterday. In the short term, this currency pair is forming a cup and handle pattern, suggesting a continued preference for selling.
My target is 1.263. What about you? Share your thoughts and ideas for GBPUSD in the comments!

Shorting GBPUSD after liquidity grabGBPUSD has grabbed liquidity from top and i believe it was just a fake out to grab liquidity, now it is back running between daily trend, i believe it will go down towards resistance, and stops at above previous high giving us approximately 1:10

GBPUSD continues its long-term buying strategy to 1.2800Dear traders!
GU is trading around 1,274, showing little change from late last week as it entered a short-term consolidation phase. It completely convinced me to buy in the medium to long term as it completely confirmed the break of the falling channel resistance and the strong increase so far at.
Personally, I still maintain and believe in a buy target towards 1.2800 as the 34.89 EMA continues to provide strong support for this pair.

GBPUSDThe GBP/USD pair is exhibiting a bearish outlook on the 4-hour timeframe as it follows an ascending channel pattern. Currently, the price has reached the resistance trendline of this channel. We are awaiting a bearish price action signal to confirm a selling entry. This setup suggests a potential downward movement in the near term.
