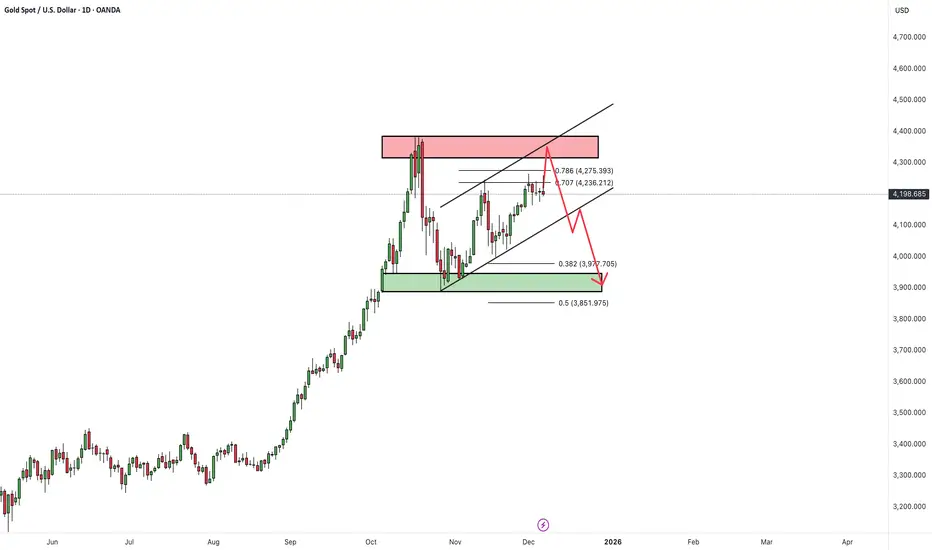
Lingrid | GOLD Contraction Phase Before Trend ContinuationOANDA:XAUUSD is sliding back into the mid-range support after printing a new higher high, where price briefly tapped the upper resistance band. The current decline resembles a multi-leg corrective pullback rather than trend exhaustion, especially with the structure still respecting the rising trend
About CFDs on Gold (US$ / OZ)
Gold price is widely followed in financial markets around the world. Gold was the basis of economic capitalism for hundreds of years until the repeal of the Gold standard, which led to the expansion of a fiat currency system in which paper money doesn't have an implied backing with any physical form of monetization. AU is the code for Gold on the Periodic table of elements, and the price above is Gold quoted in US Dollars, which is the common yardstick for measuring the value of Gold across the world.

GOLD 1H CHART ROUTE MAP UPDATE & TRADING PLAN FOR THE WEEKHey Everyone,
Please see our 1h chart levels and targets for the coming week, which is still active and in play.
We are seeing price play between two weighted levels with a gap above at 4221 and a gap below at 4169, as support. We will need to see ema5 cross and lock on either weighted level to de

GOLD → The battle for zone 4200. Bullish trend FX:XAUUSD is forming a local trading range of 4180-4230, trying to stay above 4200 after yesterday's correction ahead of important US employment and services data.
The dollar is weakening amid expectations of a Fed rate cut on December 11. News concerning Powell, namely Fed chair candidate Kev

XAUUSDHello Traders! 👋
What are your thoughts on GOLD?
Gold remains in a strong long-term bullish trend. After establishing a new All-Time High (ATH), the price has entered a corrective phase and is currently trading below a key resistance zone. This justifies the selling pressure in the short term.
We

Gold 30-Min — Volume Sell Reversal Triggered⚡Base : Hanzo Trading Alpha Algorithm
The algorithm calculates volatility displacement vs liquidity recovery, identifying where probability meets imbalance.
It trades only where precision, volume, and manipulation intersect —only logic.
✈️ Technical Reasons
/ Direction — SHORT / Reversal 4222 Area

Lingrid | GOLD Pullback Trading Opportunity from Support ZoneOANDA:XAUUSD is retracing into the 4,190–4,200 support band after an extended bullish run within the upward channel. The broader structure remains firmly bullish, with higher lows and higher highs forming along the rising trendline and each dip being absorbed by buyers. Price is now testing zone be

GOLD → Correction to support amid a bullish trend FX:XAUUSD retreated from the $4,245 level reached on Monday. A countertrend correction is forming ahead of the news. But buyers are not sleeping...
Weak US economic data has heightened expectations of an imminent Fed rate cut. The PMI index in the US manufacturing sector continued to contract.

XAUUSDHello Traders! 👋
What are your thoughts on GOLD?
Gold continues to trade within a short-term ascending channel and is now approaching the upper boundary, which aligns with a major resistance zone formed by the previous swing high. This creates a strong confluence area where sellers may become acti
GOLD → Retest of consolidation support on uptrend FX:XAUUSD is trading in a sideways range around $4,200, awaiting new labor market data to determine the Fed's policy trajectory after December's rate cut.
Weak US data (a 32K decline in ADP employment and a slight increase in ISM services to 52.6) did not change market expectations. The proba

Gold H1 – Will 4278–4280 Trigger a Drop Into 4170 Today?🟡 XAUUSD – Intraday Smart Money Plan | by Ryan_TitanTrader (01/12)
📈 Market Context
Gold continues its impressive rally as markets price in a potential rate cut by the Federal Reserve (Fed) in December. Spot gold recently surged past $4,230/oz — hitting a multi-week high — as the US Dollar Index (D

See all ideas
Summarizing what the indicators are suggesting.
Oscillators
Neutral
SellBuy
Strong sellStrong buy
Strong sellSellNeutralBuyStrong buy
Oscillators
Neutral
SellBuy
Strong sellStrong buy
Strong sellSellNeutralBuyStrong buy
Summary
Neutral
SellBuy
Strong sellStrong buy
Strong sellSellNeutralBuyStrong buy
Summary
Neutral
SellBuy
Strong sellStrong buy
Strong sellSellNeutralBuyStrong buy
Summary
Neutral
SellBuy
Strong sellStrong buy
Strong sellSellNeutralBuyStrong buy
Moving Averages
Neutral
SellBuy
Strong sellStrong buy
Strong sellSellNeutralBuyStrong buy
Moving Averages
Neutral
SellBuy
Strong sellStrong buy
Strong sellSellNeutralBuyStrong buy
Displays a symbol's price movements over previous years to identify recurring trends.