HBARUSDT 2H#HBAR is moving inside a symmetrical triangle on the 2H timeframe. Wait for the breakout or breakdown and then enter. If it breaks the triangle to the upside:
$0.1149
$0.1226
If it breaks the triangle to the downside:
$0.1025
$0.0970

HBAR is in nice entry zone!Hedera (HBAR) is one of the coins which I like because of their technology and a lot of other things that you can find on their network. Also they have a lot big companies like Ubisoft, Google and IBM as a part of the Hedera Governing Council. Price is now in good entry zone for those who would like

Bullish continuation: this looks bullish AFDescription:
- 1-2, 1-2 setup, 2nd wave (leading diagonal).
After some research concluded that there are only 2 bullish scenario's, namely 1) straight into 3rd wave or 2) in B wave (ABC). For obvious reasons, a prolonged correction would be ideal. A deeper pullback for a wave C would bring the 1.61

#HBAR/USDT LONG ENTRY#HBAR/USDT LONG ENTRY
Leverage: 3x
Entries: $0.11564
Take profit 1: $0.11931
Take profit 2: $0.12321
Take profit 3: $0.13747
Stop Loss: $0.10664
NOTE: This is just my prediction. Be sure to use STOPLOSS and remember that I am not a financial adviser. your money, your risk!
BINANCE:HBARUSDT.P

Trading Signal For HBARUSDT Trading Setup:
A Trading Signal is seen in the HBARUSDT HederaHashgraph (15m) (Futures)
Traders can open their Sell Trades NOW
⬇️ Sell now or sell on 0.1205
⭕️SL @ SL: 0.1262
🔵TP1 @ 0.1093
🔵TP2 @ 0.1000
🔵TP3 @ 0.0848
What are these signals based on?
Classical Technical Analysis
Price Action C

HBAR Trading ScenarioWe're looking at how the price of HBAR has been moving recently.
After dropping to a low of $0.0666, it bounced back up to $0.1818. The growth was more than 170%. Then, the price dropped back down to $0.0903. Right now, the asset price is trying to strengthen.
As for now, the market is showing th

HBAR 30c incomingAfter the blackrock breakout and the ETH maxi FUD bringing us back to earth, she looks fully reset and ready to run.
Only a matter of time till the trade is complete to 28/30c, and as these are high retracements on the market cap chart, I am dipping.
One of the best assets in the space, the tech i

HBAR/USDT The main trend (the whole trading history). Pivot zoneLogarithm. The time frame is 1 week. An idea for understanding the underlying trend and cycles.
The coin is the 30th most capitalized coin according to coinmarketcap as of September 9 (9 11), 2023.
The large time interval and long history of the chart shows not only the cyclicality of the past, bu

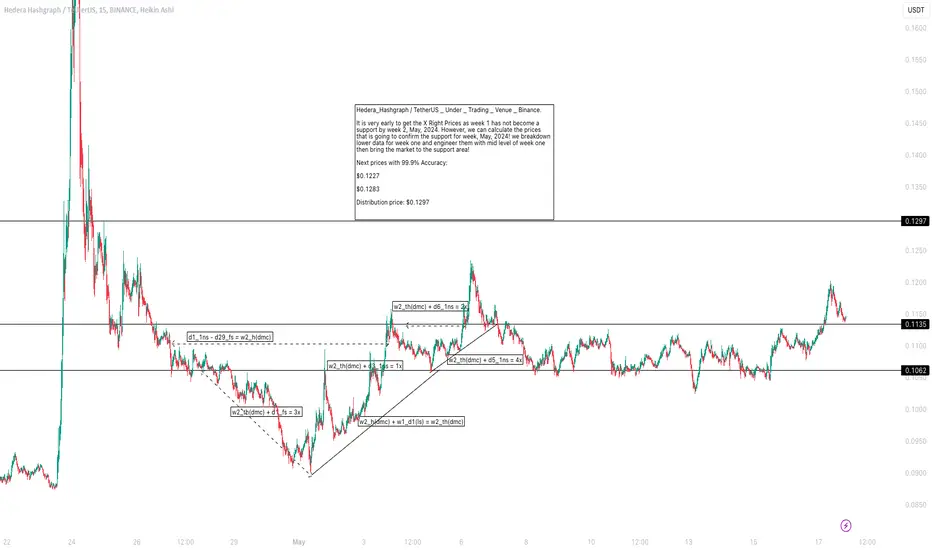
Hedera_Hashgraph / TetherUS _ Under _ Trading _ Venue _ Binance.Hedera_Hashgraph / TetherUS _ Under _ Trading _ Venue _ Binance.
It is very early to get the X Right Prices as week 1 has not become a support by week 2, May, 2024. However, we can calculate the prices that is going to confirm the support for week, May, 2024! we breakdown lower data for week one a
HBAR idea | HbarUSDT key levels HBAR | HbarUSDT key levels
best time for hbar will be only above $0.1254/0.1707
closing/opening must be above $0.1254

See all ideas