Acts momentum break pointAs we can see on the weekly there is a resistance by the 150 ma line. There is also analyst support that the price will go up.(Blue line are the predictions of the analysts)
ACLS trade ideas

ACLS Long (Semiconductor) off 61.8 for 50% upside.The chart is perfect. We've pulled back to the 61.8 level and found a base. ACLS is in the semiconductor segment and has experienced a significant pullback. I see this is a very safe entry level.

Nice entry for ACLS - Demand + GP + VAL + divergencesThere is a very nice level to enter the trade on ACLS based on technical analysis on daily timeframe. I am currently waiting if it will bounce from this level or not. If it will bounce then it can be a really nice long.
You can see there some nice levels overlapping
Nice daily demand zones
Fibonacci retracement's golden pocket level
Value area low of this year
Nice divergences forming
Money flow starting to decrease
Also the fundamentals are looking very good for this company.

ACLS - Bottom buy !!!! will be making next wave now ... Buy ACLS and hold it for long term ... expect 100-200% growth in the share
RiskMastery's Red Flag Stocks - ACLS EditionWelcome to RiskMastery's Red Flag Stocks - Stocks with bearish potential.
In this edition, we'll be looking at NASDAQ:ACLS ...
I believe this code is at a point of potential volatility.
If price can hold below $131.29 ... Bearish potential may be unlocked.
My key downside targets include:
- $113.09 (Conservative)
- $93.95 (Medium)
- $78.27 (Aggressive)
If however price breaks above $143.82 ... Bullish potential may be unlocked.
(My key risk targets - C, M,& A - are as noted on the chart)
Enjoy, and I look forward to being of further service into the future.
If you'd like to connect, feel free to reach out and comment below.
Mr RM | Risk Mastery
Disclaimer:
This post is intended for educational purposes only - Publicly available RiskMastery information & content is not intended to be financial advice in any shape or form. Please do your own research and seek advice from a licensed professional before acting on any of the information contained within this post. This post is not a solicitation or recommendation to buy, sell or hold any positions in any financial instrument. All demonstrated trades are merely incidental to the educational training RiskMastery aims to provide. You are solely responsible for your own investment and trading decisions, of which should be made only according to your own opinion, knowledge and experience. You should not rely on any of the information contained on this site or contained in any RiskMastery material on any website or platform. You assume the sole risk of any trade or investment you elect to make. RiskMastery and affiliates shall not be liable to you for any monetary losses or any other damages incurred directly or indirectly, from your use, reliance or reference of RiskMastery materials, content and educational information. Thank you for your understanding and cooperation - We look forward to working with you into the future to navigate the fine line of trading and investment success.


🟩 ACLS - +25% WINI posted the entry on 1st of January.
2 weeks later I am posting an exit to the trade idea
Click below to see the entry post as evidence

🟨 2023 WATCHLIST: ACLS2023 WATCHLIST
A series of stocks that i will be monitoring at the beginning of 2023
Here is a new issue from the Semiconductor Industry.
Relative Strength (IBD): 95
IPO: 2000
Sales acceleration:
Jun-22: 50%
Sep-22: 30%
Funds acceleration:
Jun-22: 499
Sep-22: 496

Selling Idea practicing trading manually using my indicatorThis is for educational or entertainment purposes.

ACLS shortAxcelis Technologies Inc. produces components for the semiconductor industries. I assume the stock price will drop to $56.50.
My trade levels
Entry: $74.34
Take profit: $56.50
Stop loss: $80.32
Risk/reward: 2.98

Head and shoulder on the weekly chartSeveral bearish signs are visible on the weekly chart.
Let's take the Head and Shoulder pattern as our first example.
We are touching its base (52.6) for the third time and did not bounce, meanwhile, the overall market rebounds (a bit).
Second, the support-line (March 2020) broke and acts now as a resistance.
The price even touched it once, and was rejected (31 May, 64.08).
Besides, the RSI indicator is constantly decreasing and is far from oversold.
Taking this information into account, the next support could be either the S1 weekly Pivot (43.23) or the volume shelf (40.12).
However, please note that a bullish divergence is starting to play out.
Bullish divergence is when the price makes a lower low, but a higher high appears on an indicator (MACD).


ACLS - Axcelis TechnologiesWould like a pullback into the 50-day line to get long ACLS.
Just had a beat and raise report and has ran up on huge volume since. The growth estimates are very good and the company operates in what may be the best area of the market, semiconductors.

ACLSif price reach to support area look for buy setup.
Please follow and like the idea for Support and More ideas like this and share your ideas and charts in Comments Section..!!
Thanks for Your Love :)

ACLS has been a recent market leader, high tight flag forming. We want to see few more days of tightening to prove flag is ripe for a new leg higher. /ES had sell day yesterday, digesting today... don't want to get long into a broader market PB. Caution.


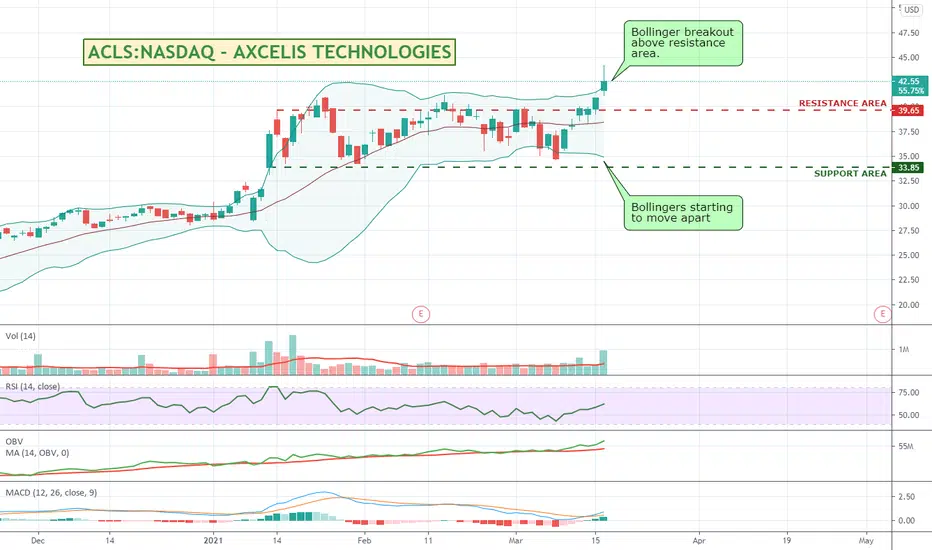
AXCELIS TECHNOLOGIES - Bollinger Breakout Above Resistance AreaWith the global semi conductor shortage I thought I would have a bit of a look around at some of the equipment suppliers and see if any of them were looking interesting.
From their website: At Axcelis, we have a single goal: to help semiconductor manufacturers achieve the highest quality and yield, with the lowest cost of ownership. We deliver on that goal with ion implant platforms based on unique enabling technologies that provide unmatched purity, precision and productivity. The result: competitive advantage for our customers—and rapid growth for Axcelis. (Source: www.axcelis.com)
So why do I like Axcelis.
I thought for the fun of it I would give a bit more insight into what I look at. I can do all of the below in one quick glance at the chart and don't need to use most of the indicators, but they are nice for confirmation.
I found Axcelis by using the TradingView Screener to look for Bollinger breakouts with higher than normal volume.
The upper and lower Bollingers are starting to move apart indicating growing momentum.
They are up 217% year to date showing positive momentum and investor belief in the business.
They have broken out above a previous significant resistance area.
The middle Bollinger line (20 period moving average) is horizontal, showing price has been stable moving sideways for a while consolidating and building a good base.
The RSI is moving up through 60 showing momentum and still at a good value area.
The recent volume is significantly higher than its 14 day moving average - so much higher than normal.
The On Balance Volume is moving away from its 14 day moving average showing buyers are currently in control and building.
The MACD has crossed up and is accelerating away from its signal line - and the histogram is building a darker green hill also showing momentum.
It is past earnings so I don't have to worry about earnings surprises.
I have read their about us on their website twice and I still don't know what they do - so must be high tech :)
Craaaazy people might look at the chart and call it a double-bottom or a W pattern which is often bullish.
Best of all it is up 1.7% in the pre-market confirming most of the above.
On the downside, there is always a chance that the price will pull back to re-test the former resistance line and perhaps re-run from there.
As such I would put a stop loss a bit below that and see how it all goes. If it ran for a while I would move to a 17% Trailing Stop Loss to it to hang onto it for a while.
Fingers crossed.
Hope the above was useful. Comment like if so :)
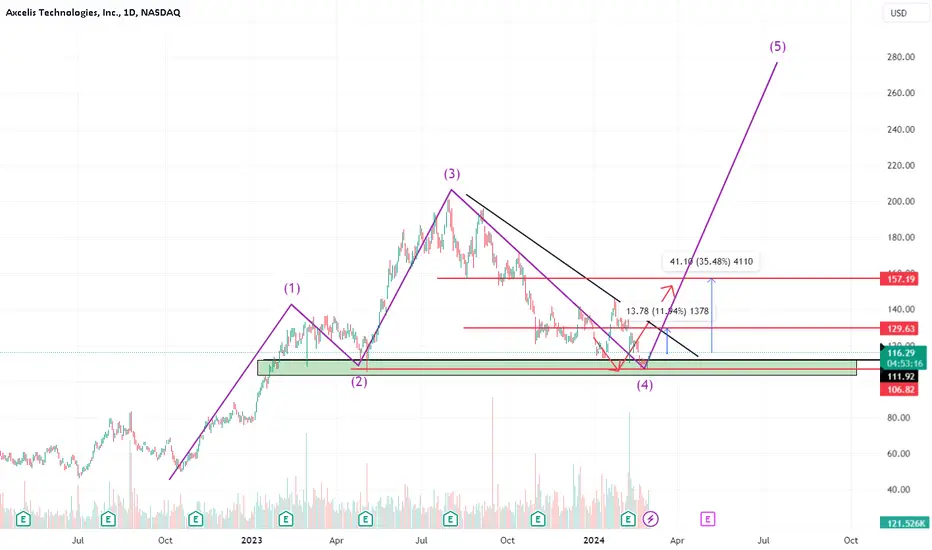
$ACLS - Wave 5 underway...heading north of 50?Lots of interesting things happening here...
1) Ichimoku cloud on every time frame, from 30 min to weekly, showing green.
2) EW count shows what looks to be the start of a Wave 5. If we come down a bit and bounce from 37-38, that will be confirmation of W2 of W5. $38 is also the 21 EMA support.
3) The equal legs target of both W1 and W3 land at the 50% and 61.8% inverse retracement of W4. This shows price confluence around $50
4) The pitchfork median should act as a magnet and once we cross the $41.20 high, we should continue to the top 0.5 and 1 band
5) The Fib time extension shows a 1:1 extension in mid June right around where the W3 and W1 equal leg targets finish (the two grey rectangles)
6) Hidden bullish divergence....price is making higher lows as RSI makes lower lows
7) MACD on daily timeframe has just flipped green with bulls in control.
8) Earning coming up on May 5, so we could see an early run up to earnings, especially since the FIb time 1.618 level is around there too.

ACLS Long term leap- 200 EMA just converged with the 50 EMA;
and the stock is below both: bullish signal
- Recently hit a support level at 20.43, 21.18
- Reversed it's trend and began trading within
a new regression channel
- A break of the current Fib/resist line at $23.02,
could see higher highs
Optimal Entry at support levels/ or a bounce of
21.71-21.81 level
PT1: 27.26, PT2: 34.52, LT PT: 40


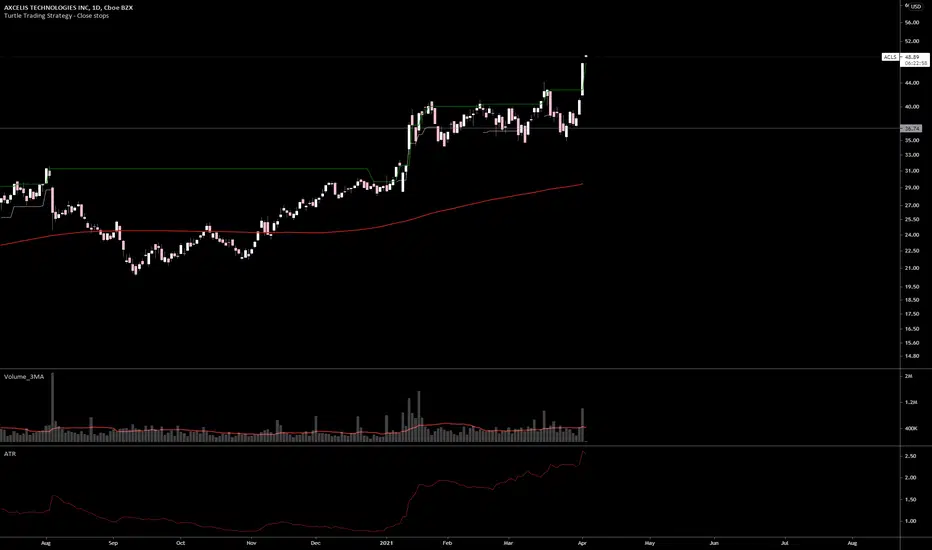
Stock following 21 EMALast quarter EPS surprise 28%. this stock has been following it's 21day EMA on its daily time frame. it also has an amazing move back in Feb 06 due to the 77% earning surprise. Support and resistance levels are 25.5 and 23.5. This might not be a good entries, but when the price hits it's 21 EMA, make sure to grab 1/4 position.
Axcelis Technologies, Inc. engages in the design, manufacture and service of dry strip, ion implantation and other processing equipment used in the fabrication of semiconductor chips.

AXCELIS TECHNOLOGIES INCif the price breaks with force and closes below the horizontal white line a high probability that the next target is $20.45
if the price does not break and closes below the horizontal white line a high probability that the next target is $25.08
don't forget to subscribe to receive updates if you find interesting what I do
