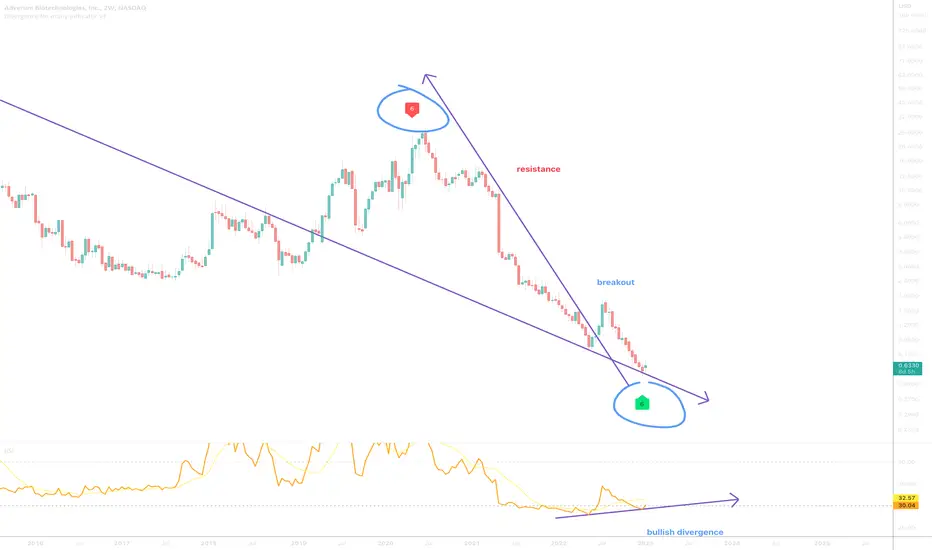
Adverum Biotechnologies, Inc.On the above bi-Weekly chart price action has corrected over 90% since June 2020. A number of reasons now exist to be bullish , including:
1) A strong buy signal prints (not shown).
2) Regular bullish divergence . Multiple oscillators printing divergence.
3) Price action confirms support on past resistance.
4) Falling wedge breakout + backtest.
Is it possible price action falls further? Sure.
Is it probable? No.
Ww
Type: trade
Risk: <=6% of portfolio
Timeframe: Don’t know.
Return: Don’t know
Stop loss: <= 50 cents
ADVM trade ideas
ADVM | Adverum Biotechnologies, Inc. Healthcare US STOCKSBullish trend 📉
Stock: ADVM | Adverum Biotechnologies, Inc.
Healthcare | Biotechnology | USA | NASDAQ
Trend Analysis: The stock's price has been consistently following a uptrend characterized by higher highs and higher lows. Traders may look for buying opportunities as the stock approaches the buying limit.

ADVM major resistance just broke 🚀trend resistance goes back to 2021, barely breaking now in 2023!
also recently broke local trend resistance, I could see this having a rally to 1.5-2.5 in next few weeks or so
boost and follow for more, thanks 💙

ADVMExpecting ADVM to stay above this zone and presumably hit the first pt which is the dashed line at $1.66 with the final pt at $1.75

time to add target 2.25time to add target 2.25 stoploss 1.13..Adverum is moving forward with its eye disease gene therapy that caused headaches in April 2021, but is doing so with fewer staff on board.
The biotech is laying off 78 employees, or about 38% of its workforce, in order to conserve cash and keep the lights on into 2025, according to an SEC filing.

short term corective sellwe are likely to have a short term sell from an overall bullish impulsive move

ADVM Technical Analysis 🧙Adverum Biotechnologies Inc is a US-based clinical-stage gene therapy company. It develops gene therapy product candidates intended to provide durable efficacy by inducing sustained expression of a therapeutic protein. The company has primarily generated revenue through license, research and collaboration arrangements with its strategic partners. Its lead product candidate is ADVM-022 which is a single, in-office intravitreal (IVT) injection gene therapy designed to deliver long-term durability with treatment response, reduce the treatment burden of frequent anti-vascular endothelial growth factor (anti-VEGF) injections, and improve real-world vision outcomes for patients.

Adverum Biotechnologies Inc 🧙Adverum Biotechnologies Inc is a US-based clinical-stage gene therapy company. It develops gene therapy product candidates intended to provide durable efficacy by inducing sustained expression of a therapeutic protein. The company has primarily generated revenue through license, research and collaboration arrangements with its strategic partners. Its lead product candidate is ADVM-022 which is a single, in-office intravitreal (IVT) injection gene therapy designed to deliver long-term durability with treatment response, reduce the treatment burden of frequent anti-vascular endothelial growth factor (anti-VEGF) injections, and improve real-world vision outcomes for patients.
If you want not to miss ideas like this one,🎯 subscribe and press a thumb up! 👍 Have a question? Don't be shy to ask! 🤓 Interested to study how to analyze charts, follow me!


ADVM - Long Setup Watch for a break of 3.80 Stop signal 3.43. First target 4.43., Second target Momentum

ADVM reiterationWith the recent advancements about the possible change of board members and the earnings report, finally ADVM should start its climb. The first target is $3.80.

ADVM BearishADVM is following it's previous bearish sentiment pattern as it has also gapped down. MACD shows bearish sentiment and both in long-term and short-term trend this stock isn't showing sign of recovery anytime soon.

ADVR updateI think it hit the bottom. From this point on, it will most likely move up (considering all the volume going in). Any news catalyst will easily trigger the stock.
About my point about Phase 2 trial issue in an earlier post, any biopharma company has the risk of a failed Phase 2 trials and/or side-effects. That is why they do these trials, not immediately distribute to public. I am optimistic with the company's vision.

ADVM's failed Phase 2 trial and good opportunity to go long.After their Phase 2 trial issues, the price sank like titanic.
It may be the lowest price and it may be a good opportunity to go long.
Analyst predictions for the company goes as high as $28.

ADVM Technical Analysis 🧙Adverum Biotechnologies Inc is a US-based clinical-stage gene therapy company. It develops gene therapy product candidates intended to provide durable efficacy by inducing sustained expression of a therapeutic protein. The company has primarily generated revenue through license, research and collaboration arrangements with its strategic partners. Its lead product candidate is ADVM-022 which is a single, in-office intravitreal (IVT) injection gene therapy designed to deliver long-term durability with treatment response, reduce the treatment burden of frequent anti-vascular endothelial growth factor (anti-VEGF) injections, and improve real-world vision outcomes for patients.
If you want more trading ideas like this one ,🎯 press a thumb up! 👍 Have a question? Don't be shy to ask! 🤓 Interested to study how to analyze charts, follow me!


ADVMgood buy around 12, but think it's good here too. institutional interest, maybe a bumpy ride for a moment for i think hitting 16-17 in a few weeks is reasonable if market cooperates


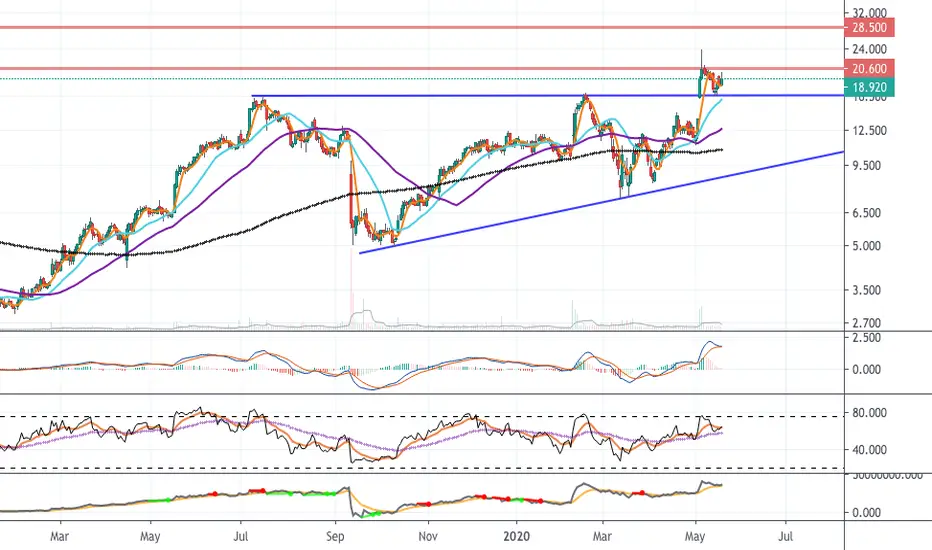
ADVM Showing Strong Momentum Price recently broke out of 10 month triangle formation. I am looking at price support atop breakout level @16.25 and the accelerating divergence of the 50 MA and 200 MA without the two ever crossing. On Balance Volume appears to be primed for a move higher without pulling back to 100 EMA and the MACD appears to me to be primed for a reacceleration as well, which conveys continuation higher will come with high momentum and a large and fast move could be upon us. Holding the breakout level at 16.25 is critical to bull thesis, prior gap fill to $28.50 is certainly possible, $26 seems reasonable. I am looking to enter full position at 20.50, which was the close of the long upper wick candle May 6.
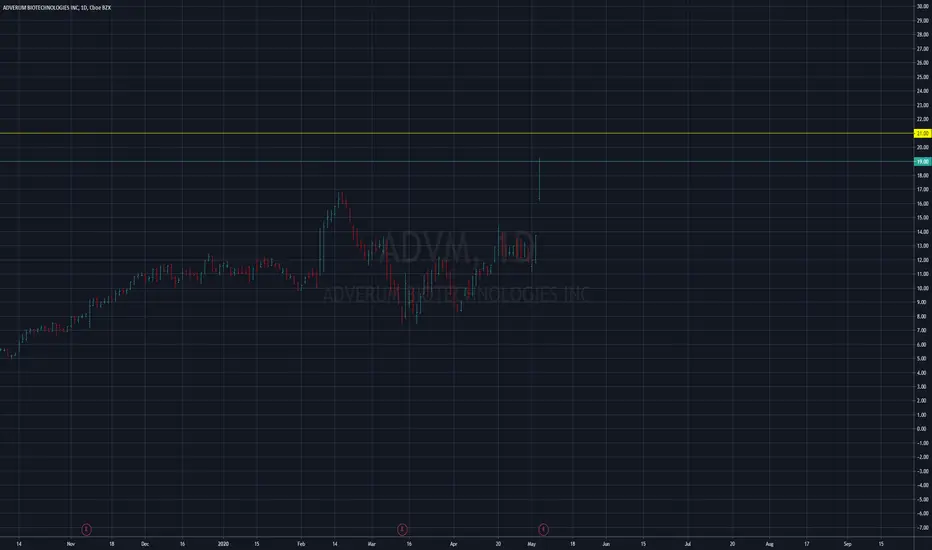
ADVERUM BIOTECHNOLOGIES INC
Hey, everybody.
Paper's pretty good before it gets up.
There's a strong historical level 21 ahead.
Let's see how we approach it.
If we get to the big bars, I'll expect a false breakout.
I will short it after it