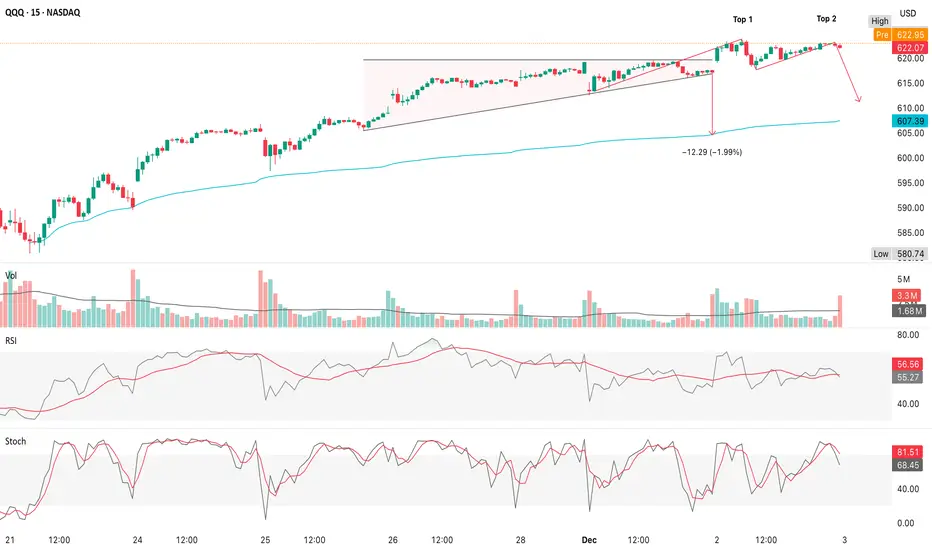
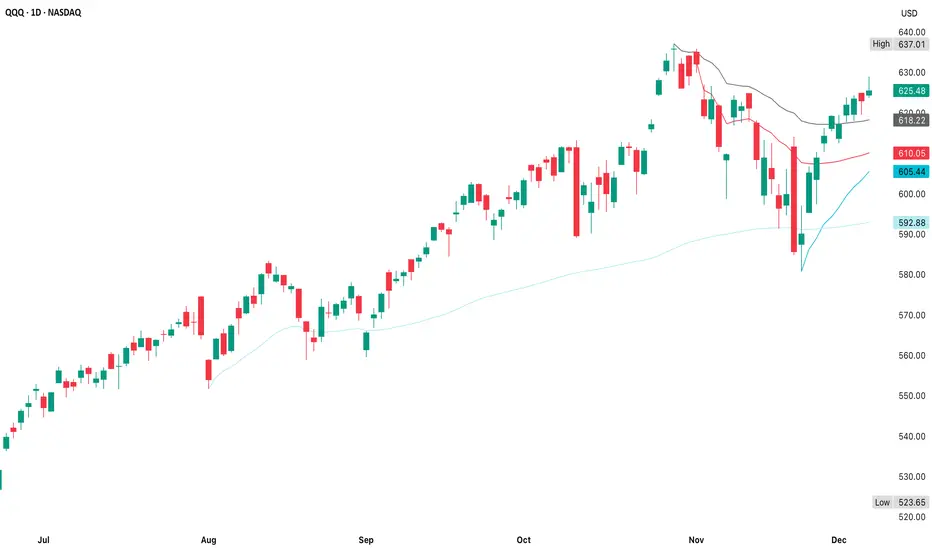
Qqq And tech sectorsI think in the coming week we will see Qqq close gap at 632, there is a chance for a pullback to 618-620 also this week.. I'll explain below how I come to both conclusions..
First The bad :
I'll start with The TVC:VIX
Fallen wedge here which is bullish for the vix... looks like a minimum bounc
Key facts today
Key stats
About Invesco QQQ Trust Series I
Home page
Inception date
Mar 10, 1999
Structure
Unit Investment Trust
Replication method
Physical
Dividend treatment
Distributes
Distribution tax treatment
Qualified dividends
Income tax type
Capital Gains
Max ST capital gains rate
39.60%
Max LT capital gains rate
20.00%
Primary advisor
Invesco Capital Management LLC
Distributor
Invesco Distributors, Inc.
ISIN
US46090E1038
QQQ is one of the most established and actively traded ETFs in the world, albeit one of the most unusual. The product is one of a few ETFs structured as a unit investment trust. Per the rules of its index, the fund only invests in nonfinancial stocks listed on NASDAQ, and effectively ignores other sectors too, causing it to skew massively away from a broad-based large-cap portfolio. QQQ has huge tech exposure, but it is not a 'tech fund' in the pure sense either. The fund's arcane weighting rules further distance it from anything close to plain vanilla large-cap or pure-play tech coverage. The ETF is much more concentrated in its top holdings and is more volatile than our vanilla large-cap benchmark. Still, the fund has huge name recognition for the underlying index, the NASDAQ-100. In all, QQQ delivers a quirky but wildly popular mash-up of tech, growth, and large-cap exposure. The fund and index are rebalanced quarterly and reconstituted annually.
Related funds
Classification
What's in the fund
Exposure type
Electronic Technology
Technology Services
Stock breakdown by region
Top 10 holdings

QQQ Retest Into Resistance
1. AW1!/US10Y is a bond market stress gauge
This futures-to-UST ratio pushing 27-28 after bottoming near 21 shows a persistent grind higher, which usually reflects firmer demand for risk relative to sovereign debt or a rotation into duration (falling yields) boosting growth-sensitive ratios
Si
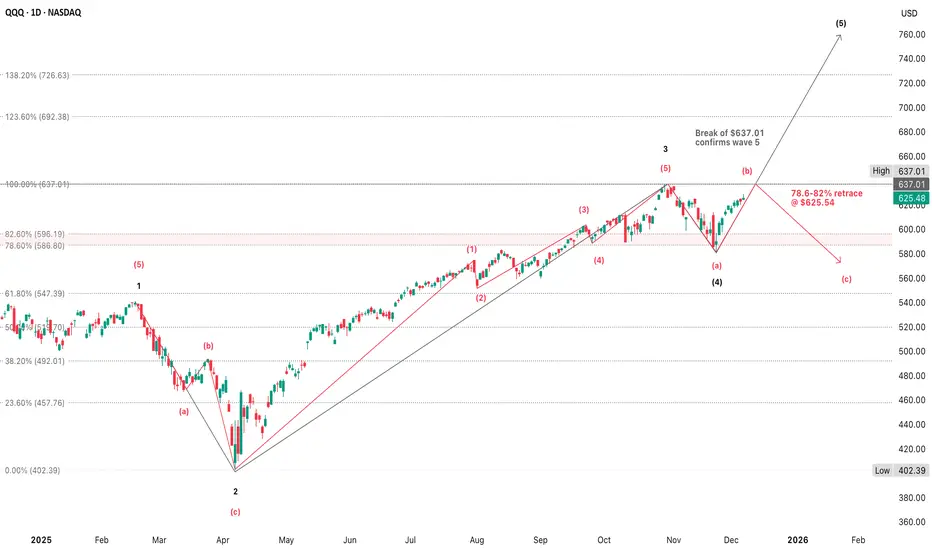
QQQ Heading to 635 soonBy breaking the current resistance layer chances are high we will be heading to 635 this week.

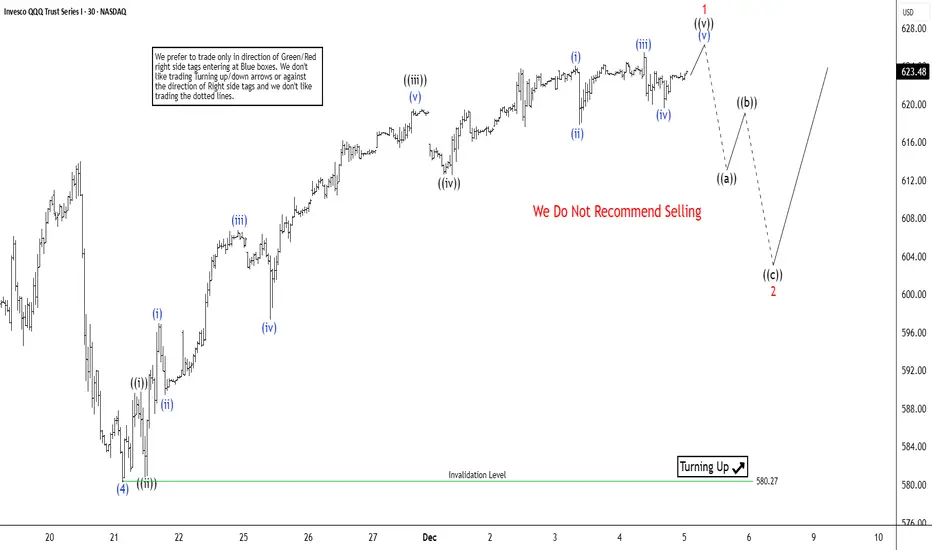
QQQ Short Term Cycle Nearing End; Pullback to Attract BuyersThe short-term Elliott Wave outlook for the Nasdaq 100 ETF (QQQ) indicates that the cycle from the April 2025 low remains active. Wave (4) of the ongoing impulse concluded at 580.27, and the ETF has since resumed its upward trajectory. To confirm continuation, price must break above the prior wave (
Stock Market Forecast | BTC TSLA NVDA AAPL AMZN META MSFTStock Market Forecast | CRYPTOCAP:BTC SP:SPX NASDAQ:NDX CME_MINI:ES1!
Mag 7 | TSLA NVDA AAPL AMZN META MSFT GOOGL

QQQ (5 December)When QQQ tops on the daily timeframe, you typically see upper-band overextension, multiple rejection wicks, bearish engulfing candles, a clear lower high formation, EMA breakdown & shrinking momentum + rising volatility, but the chart shows the opposite
Price bounced cleanly off the mid-band & is

QQQ End of a Corrective Bounce?The Thanksgiving bounce was real & technically healthy with a sharp V-reversal off ~$585
Buyers regained key MAs (20d & 50d), oscillators turned upward & price broke out of the panic low without resistance
Last week’s action built a tight coil under a clear ceiling & this type of setup often res
QQQ Is QQQ topping?The 4H chart shows a clean breakout retest attempt as price is now testing the $625 resistance, the same area that previously rejected multiple times, but this time the backdrop is different
RSI shows no bearish divergence & sits at ~63 (bullish, but not overbought) which supports continuation up

QQQ Implied Move RangeQQQ's implied expected move is calculated using the current option chain to find the ATM straddle (cost of ATM call + ATM put for nearest expiry)
Expected Move (≈ 1σ) ≈ $0.85 × (ATM Straddle Premium)
The result gives a one-standard-deviation range (≈ 68% probability) for the underlying’s move ov
QQQ VWAP Based EntriesWhen price moves from below to above an AVWAP decisively, it signals short covering & a shift in control from sellers to buyers & when 2 or more AVWAPs converge liquidity concentrates, reversals or breakouts often happen there & these are the spots where traders take reversal trades, breakout entrie
See all ideas
Summarizing what the indicators are suggesting.
Oscillators
Neutral
SellBuy
Strong sellStrong buy
Strong sellSellNeutralBuyStrong buy
Oscillators
Neutral
SellBuy
Strong sellStrong buy
Strong sellSellNeutralBuyStrong buy
Summary
Neutral
SellBuy
Strong sellStrong buy
Strong sellSellNeutralBuyStrong buy
Summary
Neutral
SellBuy
Strong sellStrong buy
Strong sellSellNeutralBuyStrong buy
Summary
Neutral
SellBuy
Strong sellStrong buy
Strong sellSellNeutralBuyStrong buy
Moving Averages
Neutral
SellBuy
Strong sellStrong buy
Strong sellSellNeutralBuyStrong buy
Moving Averages
Neutral
SellBuy
Strong sellStrong buy
Strong sellSellNeutralBuyStrong buy
Displays a symbol's price movements over previous years to identify recurring trends.
Frequently Asked Questions
An exchange-traded fund (ETF) is a collection of assets (stocks, bonds, commodities, etc.) that track an underlying index and can be bought on an exchange like individual stocks.
QQQ trades at 628.59 USD today, its price has risen 0.12% in the past 24 hours. Track more dynamics on QQQ price chart.
QQQ net asset value is 625.08 today — it's risen 0.60% over the past month. NAV represents the total value of the fund's assets less liabilities and serves as a gauge of the fund's performance.
QQQ assets under management is 410.55 B USD. AUM is an important metric as it reflects the fund's size and can serve as a gauge of how successful the fund is in attracting investors, which, in its turn, can influence decision-making.
QQQ price has risen by 2.75% over the last month, and its yearly performance shows a 20.05% increase. See more dynamics on QQQ price chart.
NAV returns, another gauge of an ETF dynamics, have risen by 0.60% over the last month, showed a 8.14% increase in three-month performance and has increased by 19.32% in a year.
NAV returns, another gauge of an ETF dynamics, have risen by 0.60% over the last month, showed a 8.14% increase in three-month performance and has increased by 19.32% in a year.
QQQ fund flows account for 22.74 B USD (1 year). Many traders use this metric to get insight into investors' sentiment and evaluate whether it's time to buy or sell the fund.
Since ETFs work like an individual stock, they can be bought and sold on exchanges (e.g. NASDAQ, NYSE, EURONEXT). As it happens with stocks, you need to select a brokerage to access trading. Explore our list of available brokers to find the one to help execute your strategies. Don't forget to do your research before getting to trading. Explore ETFs metrics in our ETF screener to find a reliable opportunity.
QQQ invests in stocks. See more details in our Analysis section.
QQQ expense ratio is 0.20%. It's an important metric for helping traders understand the fund's operating costs relative to assets and how expensive it would be to hold the fund.
No, QQQ isn't leveraged, meaning it doesn't use borrowings or financial derivatives to magnify the performance of the underlying assets or index it follows.
In some ways, ETFs are safe investments, but in a broader sense, they're not safer than any other asset, so it's crucial to analyze a fund before investing. But if your research gives a vague answer, you can always refer to technical analysis.
Today, QQQ technical analysis shows the buy rating and its 1-week rating is buy. Since market conditions are prone to changes, it's worth looking a bit further into the future — according to the 1-month rating QQQ shows the buy signal. See more of QQQ technicals for a more comprehensive analysis.
Today, QQQ technical analysis shows the buy rating and its 1-week rating is buy. Since market conditions are prone to changes, it's worth looking a bit further into the future — according to the 1-month rating QQQ shows the buy signal. See more of QQQ technicals for a more comprehensive analysis.
Yes, QQQ pays dividends to its holders with the dividend yield of 0.45%.
QQQ trades at a premium (0.00%).
Premium/discount to NAV expresses the difference between the ETF’s price and its NAV value. A positive percentage indicates a premium, meaning the ETF trades at a higher price than the calculated NAV. Conversely, a negative percentage indicates a discount, suggesting the ETF trades at a lower price than NAV.
Premium/discount to NAV expresses the difference between the ETF’s price and its NAV value. A positive percentage indicates a premium, meaning the ETF trades at a higher price than the calculated NAV. Conversely, a negative percentage indicates a discount, suggesting the ETF trades at a lower price than NAV.
QQQ shares are issued by Invesco Ltd.
QQQ follows the NASDAQ 100 Index. ETFs usually track some benchmark seeking to replicate its performance and guide asset selection and objectives.
The fund started trading on Mar 10, 1999.
The fund's management style is passive, meaning it's aiming to replicate the performance of the underlying index by holding assets in the same proportions as the index. The goal is to match the index's returns.