4/23/24 - $STX print4/23/24 - $vrockstar - a short on multiples and industry factors - but i'm just not shorting single names on short amt of work. defn not a buy and if pops on mediocre results consider shorting in cash account
STX trade ideas

$STX exhibiting a Head and ShoulderNASDAQ:STX is showing signs of weakness with a Head and Shoulder pattern. The RSI is also pointing down showing weakness too. NASDAQ:SMCI already is plunging today after holding onto its support zone and had a Head and Shoulder pattern. Follow me on X account JLTrades@VWAPP88

Seagate Technology Stock Received Upside from Morgan StanleySeagate Technology Holdings Plc, known for its expertise in designing and manufacturing data storage devices, has recently received the attention of Morgan Stanley analysts and is earning a positive outlook. This endorsement comes amid expectations of the company reaching new price highs and making significant advancements in data storage technology.
Morgan Stanley's optimism is partly driven by the ongoing recovery in the data centre market, which is expected to continue. The upcoming cycle of storage hardware upgrades and the burgeoning demand for artificial intelligence (AI) technologies presents a fertile ground for Seagate's growth. As AI services often rely on extensive databases, the demand for substantial storage solutions becomes apparent, positioning Seagate favourably within the market.
Given this positive backdrop, a technical analysis of Seagate Technology's stock (STX) could provide valuable insights into its future price movements.
On the daily (D1) chart, Seagate's stock has established a support level at 85.26 USD and a resistance level at 98.80 USD, creating a wide trading channel with potential for an upward breakout. This pattern suggests a bullish outlook, with the stock potentially breaking through the resistance level and reaching new highs.
For traders looking at the hourly (H1) timeframe, a breach above the 98.80 USD resistance level could indicate a favourable entry point for long positions. A short-term price target is identified at 106.80 USD, with a medium-term goal extending up to 117.69 USD if the stock maintains its momentum beyond the initial breakout.
—
Ideas and other content presented on this page should not be considered as guidance for trading or an investment advice. RoboMarkets bears no responsibility for trading results based on trading opinions described in these analytical reviews.
The material presented and the information contained herein is for information purposes only and in no way should be considered as the provision of investment advice for the purposes of Investment Firms Law L. 87(I)/2017 of the Republic of Cyprus or any other form of personal advice or recommendation, which relates to certain types of transactions with certain types of financial instruments.
Risk Warning: CFDs are complex instruments and come with a high risk of losing money rapidly due to leverage. 66.02% of retail investor accounts lose money when trading CFDs with this provider. You should consider whether you understand how CFDs work and whether you can afford to take the high risk of losing your money.

SEAGATE: Potential BuySimilar behavior on last earnings. I don't have a reason to think we'll exit this ascending channel soon. Areas marked to look out for.

STXUptrend
Although it was a weak pullback, I can consider it as a good buying opportunity by target as about 117 and setting a good place for SL at about 95.

STXThis Week FORECAST
Opportunity for STX. This setup trading idea is for intraday. >> TAYOR
Risk Factors:
1. Market conditions, unexpected news, or external events could impact the trade.
2. Always use risk management strategies to protect your capital.

Seagate’s Tight PullbackSeagate Technology rallied in late 2023 and consolidated last month. Now some traders may see potential for the data-storage company to continue higher.
First consider some longer-term patterns. STX broke out to a new 52-week high in mid-November and peaked at $79.42 later that month. Prices continued upward in December and in January pulled back to hold the same monthly high from November.
Second, faster simple moving averages (SMAs) are above the slower ones. Notice how the red 50-day SMA is above the gray 100-day SMA, which is above the green 200-day SMA. That may reflect a longer-term uptrend has begun.
Turning to the shorter term, a big price swing in January seems to be resolving with another higher low. Notice how last week’s low matched the highest weekly close of 2023.
STX also trying to hold the 21-day exponential moving average (EMA). Finally, the 8-day EMA is above the 21-day EMA, which may reflect a shorter-term uptrend.
TradeStation has, for decades, advanced the trading industry, providing access to stocks, options and futures. See our Overview for more.
Important Information
Past performance, whether actual or indicated by historical tests of strategies, is no guarantee of future performance or success. There is a possibility that you may sustain a loss equal to or greater than your entire investment regardless of which asset class you trade (equities, options, futures or cryptocurrencies); therefore, you should not invest or risk money that you cannot afford to lose. Online trading is not suitable for all investors. View the document titled Characteristics and Risks of Standardized Options at www.TradeStation.com . Before trading any asset class, customers must read the relevant risk disclosure statements on www.TradeStation.com . System access and trade placement and execution may be delayed or fail due to market volatility and volume, quote delays, system and software errors, Internet traffic, outages and other factors.
Securities and futures trading is offered to self-directed customers by TradeStation Securities, Inc., a broker-dealer registered with the Securities and Exchange Commission (“SEC”) and a futures commission merchant licensed with the Commodity Futures Trading Commission (“CFTC”). TradeStation Securities is a member of the Financial Industry Regulatory Authority, the National Futures Association (“NFA”), and a number of exchanges. TradeStation Crypto, Inc. offers to self-directed investors and traders cryptocurrency brokerage services under federal and state money services business/money-transmitter and similar registrations and licenses.
TradeStation Securities, Inc., TradeStation Crypto, Inc., and TradeStation Technologies, Inc. are each wholly owned subsidiaries of TradeStation Group, Inc., all operating, and providing products and services, under the TradeStation brand and trademark. TradeStation Crypto, Inc. offers to self-directed investors and traders cryptocurrency brokerage services. It is neither licensed with the SEC or the CFTC nor is it a member of NFA. When applying for, or purchasing, accounts, subscriptions, products and services, it is important that you know which company you will be dealing with. Visit www.TradeStation.com for further important information explaining what this means.

STX - 10 months CUP & HANDLE══════════════════════════════
Since 2014, my markets approach is to spot
trading opportunities based solely on the
development of
CLASSICAL CHART PATTERNS
🤝Let’s learn and grow together 🤝
══════════════════════════════
Hello Traders ✌
After a careful consideration I came to the conclusion that:
- it is crucial to be quick in alerting you with all the opportunities I spot and often I don't post a good pattern because I don't have the opportunity to write down a proper didactical comment;
- since my parameters to identify a Classical Pattern and its scenario are very well defined, many of my comments were and would be redundant;
- the information that I think is important is very simple and can easily be understood just by looking at charts;
For these reasons and hoping to give you a better help, I decided to write comments only when something very specific or interesting shows up, otherwise all the information is shown on the chart.
Thank you all for your support
🔎🔎🔎 ALWAYS REMEMBER
"A pattern IS NOT a Pattern until the breakout is completed. Before that moment it is just a bunch of colorful candlesticks on a chart of your watchlist"
═════════════════════════════
⚠ DISCLAIMER ⚠
The content is The Art Of Charting's personal opinion and it is posted purely for educational purpose and therefore it must not be taken as a direct or indirect investing recommendations or advices. Any action taken upon these information is at your own risk.
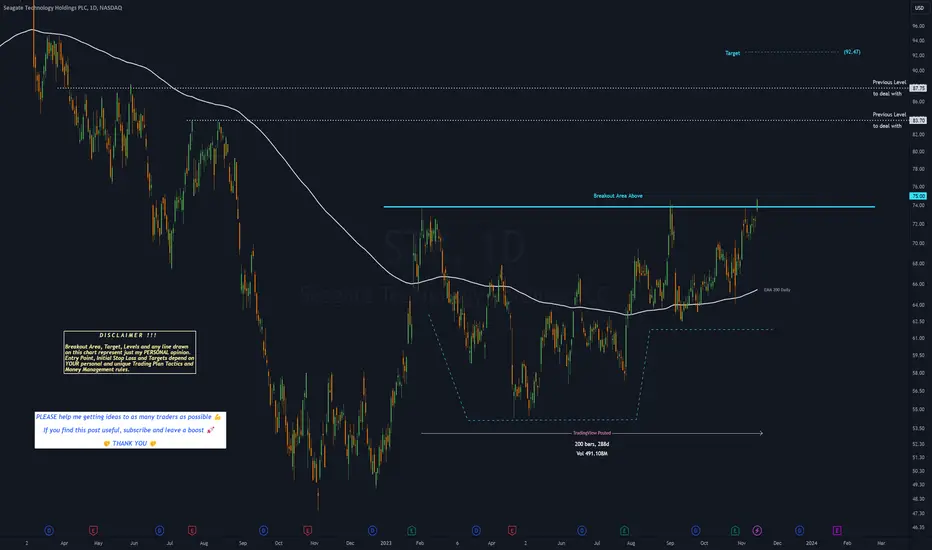
Wait for correction and wait for long term supportAs the entire market is since months in a consolidation phase, I wouldn't expect any wonders for STX.
But STX is on the long term in a good run with an upwards support zone around $57.
Two TP zone areas are possible depending on your time horizon
TP1: $77
TP2: old ATH at $110-$115

Long Picks 9/6These 4 are my top Long ideas for today into the future until the price stays above the Green TrapZone.
The picks are based on momentum, volume and price action.

STX - broke out of CUP consolidationSTX rise that began in late Dec last year was disrupted as it went into a multi-month cup consolidation from February. Last week, it finally broke above the neckline of this CUP @ 71.50 on strong volume.
A number of technical signals are now going right for STX and it appears a trend continuation is underway:
1. its 200 day moving average is now subtly curving upwards
2. MACD on its MONTHLY chart has now begun to cross up into positive territory. This is significant and likely signals a longer term bullish outlook (whip saws not withstanding).
Any dip back towards the neckline @ 71.50 will be a lower risk opportunity to long with initial stop loss below 67.50. Trail profits up should trade goes our way.
Disclaimer:
TA is about improving our odds of a successful trade (not a guarantee). This is just my own analysis and opinion for discussion and is NOT a trade advice. Kindly do your own due diligence and trade according to your own risk tolerance and don't forget that money management is (probably the most) important! Take care and Good Luck!

Results of Bull Call Spread BAOn 12/21/22 I did a Bull Call Spread on BA 195/200 at a Debit $1.90. This AM I closed at CR $5.05. May go back in Monday we shall see. Have a good weekend.

$STX with a Bullish outlook following its earnings #Stocks The PEAD projected a Bullish outlook for $STX after a Negative over reaction following its earnings release placing the stock in drift C with an expected accuracy of 100%.

STX SHORT Love the compression and all the bull volume with a shaved bottom candle.
Below all the daily moving averages

$STXIf you are looking to get into the short game this late into the cycle, look no further than the computer hard drive (HDD) sector. According to TOM's Hardware, HDD sales are down over 30% over last year due to poor PC sales. You can get a terabyte HDD on Amazon for about $40 bucks USD - incredible. Haven't research company specifics, but I'm sure margins are deteriorating big time. STX, WDC, etc....

STX - Up Channel MACD AnalysisConsidering the lack of a bullish divergence in the current MACD scenario, yet it being so similar to the previous movement, will we see continuation of the dominant uptrend? (in grey).
We will have to see if a continuation pattern on the MACD follows the current formation, as it did in the prior yellow rectangle containing the bullish divergence
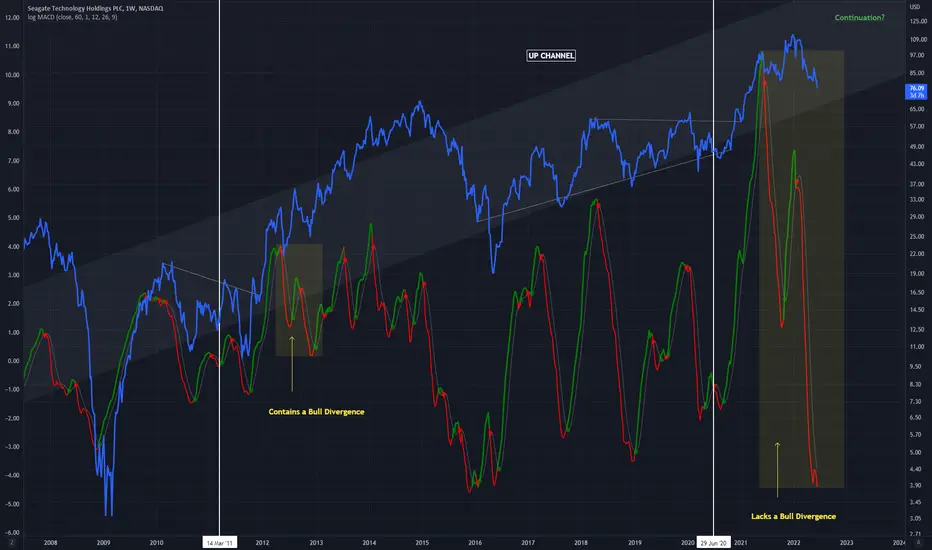
STX swing longSTX forming multi week H&S, price entering support and demand zones. Aligned good for swing long position, watching for a daily reversal.

STX Set For A Quick Jump Next Week?Based on historical movement, the trough could occur anywhere in the larger red box. The final targets are in the green boxes. The pending top should occur within the larger green box as has been the historical case. Half of all movement has ended in the smaller green box. In this instance, the signal indicated BUY on March 11, 2022 with a closing price of 87.33.
If this instance is successful, that means the stock should rise to at least 88.71 which is the bottom of the larger green box. Three-quarters of all successful signals have the stock rise 7.129% from the signal closing price. This percentage is the bottom of the smaller green box. Half of all successful signals have the stock rise 9.993% which is the end point of the black dotted arrow. One-quarter of all successful signals have the stock rise 12.625% from the signal closing price which is the top of the smaller green box. The maximum rise on record would see a move to the top of the larger green box. These are the same concepts for the levels in the red boxes as well.
The ends/vertical sides of the boxes are determined in a similar fashion. The peak of the rise can occur as soon as the next trading bar after signal close, while the max rise occurs within the limit of study at 35 trading bars after the signal. A 1% rise must occur over the next 35 trading bars in order to be considered a success. Three-quarters of successful movement occur after at least 2 trading bars; half occur within 7 trading bars, and one-quarter require at least 18 trading bars.
The black dotted arrow represents median historical movement. Medians are a good metric, but they are just one of many I use when forecasting future movement.
As always, the stock could decline the very next bar after the signal without looking back (therefore the red boxes would not come into play) or the stock may never decline (and the green boxes may never come into play).


Bullish moveBase and Break of 25 week cup formation
stops 5-7%
Target 20%
Not financial Advice please use proper risk management

$STX / Long$STX showing VCP characteristics and tightness to the right of the base. Some OHS to contend with so on the WL for now.

$HBP / Long$HBP showing VCP characteristics. Isn't as tight as I'd like but it's printed a new 10 Week RS high before price and there's demand in the base.

12/19/21 STXSeagate Technology Holdings PLC ( NASDAQ:STX )
Sector: Electronic Technology (Computer Peripherals)
Market Capitalization: 23.268B
Current Price: $104.51
Breakout price: $106.80
Buy Zone (Top/Bottom Range): $104.60-$100.00
Price Target: $123.00-$125.00
Estimated Duration to Target: 80-88d
Contract of Interest: $STX 3/18/22 105c
Trade price as of publish date: $8.15/contract
