RSI OFFERING SOME VALUABLE INSIGHTS ON 2-DAY TF CHART OF CNX500The broader market, CNX 500, on this 2-day timeframe (I had to use this timeframe as the platform doesn’t accommodate complete data on daily timeframe and identified some surprising structure) when Momentum Indicator, RSI (standard 14 period) breaches below 25 and turns up that indicates the end of

Nifty 500 is developing an Ending Diagonal? ED occurs at the end of an Impulse. Falling volume in wave e is an additional sign of loss in momentum. An actual price reversal is needed to confirm the pattern in the coming days.

NIFTY500 QUARTERLY CHARTNIFTY500 QUARTERLY CHART
As marked by the ellipse, the mentioned levels have acted as resistance in previous two occasions & is likely to see some profit booking going forward in NIFTY 500 INDEX.So a caution advised.
Its only my observation & not any suggestion or recommendation.

Nifty 500Unfortunately, less importance is given to this index by the community.
May be because we do not have FO segment for this broader index.
Things will change though, as India is shining.
Best to watch it for study purposes.

Nifty 500 broad market indiceThis is an attempt to visualize. BMI which is having largest domain of the Indian Stock Market.
As disclosed in the chart drawing, I feel, it has broken the zone and now testing the same.
It is worth watching the indices for study purpose.

Nifty500 - Sideways/DownUntil we see a breakout on the Relative Momentum trendline in the bottom half of the chart, the market breadth wont go up.
Interesting times.

NIFTY 500 is going downSince the year 2000, when NIFTY 500 was born, the last peak was always touched before upwards and onwards. That is the entire living history of NIFTY.
NIFTY 500 is the broadest perspective of the market, so there's a 90% chance your stock is in this index.
This time, it's different?

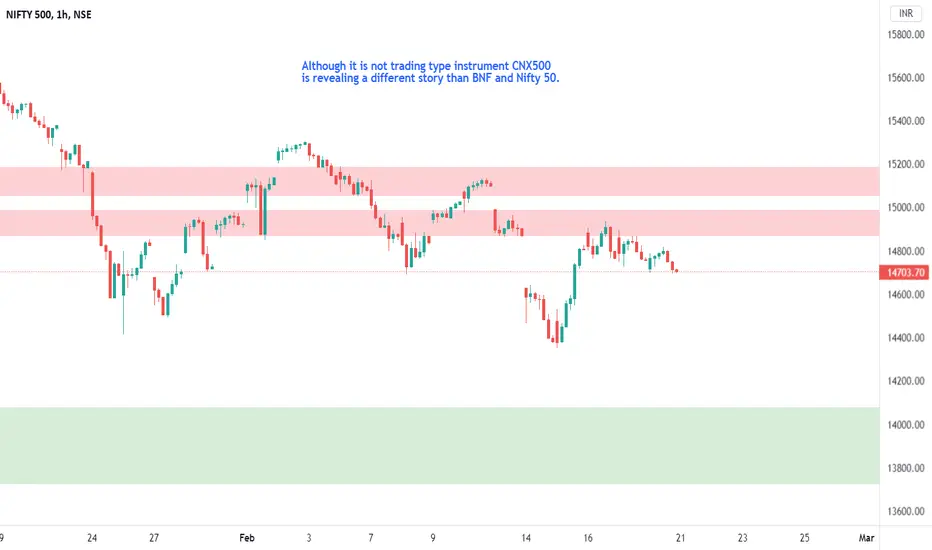
CNX500 IndiaCNX500 / Nifty 500 largest domain BMI is revealing a contra story.... One must look at it I feel.
NIFTY500 may outperform the S&P500
RSI has shown a descending triangle - upward breakout
TSI has already given a +ve crossover and now has moved over the 0 line
Similar signal in KST Indicator
Waiting for action signal on NIFTY500 is must before long entry is made
*******************************************************

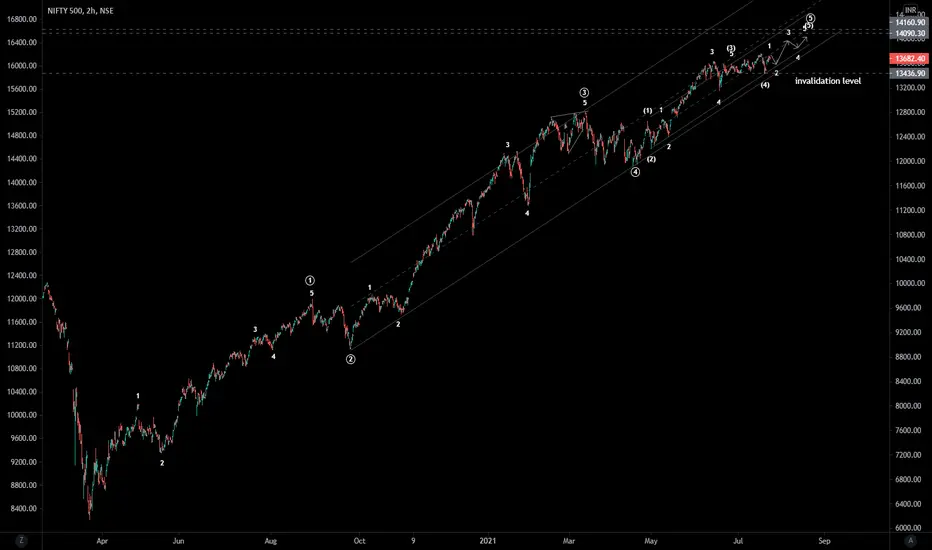
Nifty CNX 500 index - 5th of 5th wave It is in 5th of 5th wave until price remains above 13436 and target would be above 14100 approx..
See all ideas