JP Power is ready to give a huge moveJP Power has completed a long-term inverted Head and Shoulder pattern recently. Considering this positive move, we should expect a move up to double the current levels from 10.50.
Keep tracking the move and invest sensibly.
JPPOWER trade ideas

JP POWERShowing improvement in fundamental. Also showing double bottom pattern in weekly time frame also supported by key moving average. And the volume is also high in last 2weeks. price down with very low volume.
If this stock we get near 6.8 then it will be gud buy. sl will be 5.8.
Target will be very high. in one year it will be near 11.
it has gud potential upside target. follow strick sl & proper risk reward ratio. this is the only holy grail in the market.

$JPPOWERgot some spot
obv is going loco so expecting continuation.
invalid below range low
targeting blue line first

will jp power become the next suzlonthe stock has come out of a flag pattern after an 80% rally and a good consolidation
with reducing volume during consolidation and increasing volume during break out and the over all power sector is on fire


Very Bullish On montly Chart.In 2024 It can show multibagger returns, but it will be 80% Tukka. I would definitely play the bet.

$JP Power closing above INR 11-12 will be positiveInverse Head and Shoulders Pattern : The inverse head and shoulders pattern is a bullish reversal pattern that typically occurs after a downtrend. It consists of three main parts:
Left Shoulder: This is the first low point of the pattern and is followed by a rally.
Head: The head is the lowest point of the pattern and is formed after the left shoulder. It's a deeper low, indicating increased selling pressure.
Right Shoulder : The right shoulder is the final low before the trend reversal. It is followed by another rally, which indicates the potential for a bullish reversal.
JP Power Stock Analysis:
Looking at the JP Power stock, it appears that it may be forming an inverse head and shoulders pattern on the monthly chart. Here are my comments on this potential pattern:
The stock has been in a downtrend, as indicated by the left shoulder, followed by a deeper low in the form of the head.
If JP Power's closing price rises and holds above INR 11-12 on the monthly chart, this would be a positive sign. It suggests that the right shoulder is forming, and the pattern might be in play.
The inverse head and shoulders pattern's completion could signal a trend reversal from bearish to bullish. This could lead to a potential target (TGT) in the range of INR 20 to INR 25.
However, it's important to remember that technical patterns are not guaranteed, and it's crucial to consider other factors such as volume and overall market conditions before making trading decisions.
Traders and investors should monitor the stock's price action, volume, and the confirmation of the pattern before making any investment decisions.
Please note that this is a general analysis based on the provided information, and it's essential to conduct thorough research and consider various factors before making any financial decisions related to the JP Power stock.

💥Jaiprakash Power 💥-Nice Breakout💥Jaiprakash Power 💥-Nice Breakout
Capital to be deployed- 20k
Investing Price -10-11
Breakout Price-10
Stoploss-8
Targets-15-17-22
RT for max reach
#jppower #StocksToBuy #stocks #StocksToTrade #StocksInFocus #stockstowatch #StocksInNews

A Cup and Handle pattern breakout.
This time in this stock we can clearly see there is an breakout in cup and handle pattern. But the most important thing is that, whenever stock increases volume also increases. And stock have break its upper resistance with good volume. So this is also a perfect breakout. And also a perfect stock have in a portfolio.

Resistance Breakout - JPPOWERPlease look into the chart for a detailed understanding.
Consider these for short-term & swing trades with 2% profit.
For BTST trades consider booking
target for 1% - 2%
For long-term trades look out for resistance drawn above closing.
Please consider these ideas for educational purpose
Please note that, if there are some big targets, those are drawn thinking for long term.

#JPPOWER SHORT TRADE IDEA SETUPGreetings Folks,
today i have prepared a setup of JPPOWER on NSE
the analysis is as follows
- the price is in bearish structure right now
- we have some liquidity build up which adds to confirmation for our short
- 2 possible area for trades
- the zone above BSL is more favorable for our trade
dont play with fire, always use a predefined stoploss

A stock with perfect Breakout.
A saucers pattern, When a stock is trading sideways usually this pattern occurs. and it takes long time to form. In this sock from 2018 to 2022. And now we are observing that stock is trying to move above its final resistance. And Volume is also confirming the price movement. And other indicator are confirming too. According to me this is the perfect level to have a stock in portfolio.

#JPPOWER INTRADAY TRADE SETUPGreetings Folks,
today i have prepared a setup of JPPOWER on NSE
the analysis is as follows
- the price made a required retracement
- i have marked SSL which is also very important support because if it gets broken it may indicate the start of a micro bearish trend
- there is also a minor range which is also marked in the chart
- the railway narrative seems to be overrated now so trade with cautious
dont play with fire, always use predefined stoploss

JP POWERthis company has reduced its debt significantly is last few years
its in profit since 2021
wits well beolw moving averages
will it go up?
TARGET 1 -8.40 ATH-11

#JPPOWER TRADE IDEA SETUP Greetings Folks,
today i have prepared a setup on JPPOWER on NSE
the analysis is as follows
- past few days this stock has been performing well
- following a dynamic support trendline
- currently testing a static resistance which is about to break
- if tomorrow opens gap up, wait for a retest for entry
dont play with fire, always use predefined stoploss

JP Power - Multiyear Breakout ? **JP Power's Potential Multiyear Cup and Handle Formation:** A notable technical pattern is taking shape in JP Power's price chart, known as the "cup and handle." Currently, the pattern is in the "handle" phase, implying a consolidation before a potential breakout. Once the neckline is breached, this could mark the beginning of a significant upward trajectory for JP Power's stock.
**Key Indicators Pointing Towards Strength:** The stock's current situation is characterized by some key indicators. There's a surge in trading volume, reflecting heightened market interest. Furthermore, the Relative Strength Index (RSI) is on the rise, indicating growing price momentum and potential for further gains.
**Anticipating a Positive Price Movement:** The graphical representation of the chart itself provides insights. If the neckline is successfully breached, it could set the stage for a new phase of growth for JP Power. The chart might also suggest potential price targets in the future, with the possibility of the stock potentially surging by over 200% over the course of several years.
**Important Note:** It's essential to underline that this information is not intended as financial advice, but rather for educational purposes. The intricacies of financial markets can be complex, and decisions should be made based on thorough research and consultation with financial professionals.

$JPPOWER investment idea for next 7 to 10 yearsNSE:JPPOWER good investment idea for next 7-10 years.
It is trying to form an inverse H&S
nice RR if we are planning to invest for next 7 to 10 years.
Keeping SL of the recent swing lows
What do you think ?

JPPOWER | BIG OPPORTUNITYJP Power (jppower) appears to present a compelling opportunity for potential investors and traders based on a combination of fundamental and technical factors. The technical analysis suggests that the stock is displaying signs of a potential bullish trend reversal, which is supported by fundamental improvements in the company's performance. Below is a breakdown of the technical analysis:
Fundamental Improvements: The analysis begins by acknowledging significant improvements in the company's fundamentals. These improvements are likely contributing to the positive sentiment surrounding the stock.
Bottom Opportunity: The technical analysis highlights the potential to enter the market at a favorable point, typically referred to as the "bottom." This indicates that the stock might have experienced a recent downtrend and is now positioned for a potential upward move.
Inverted Head and Shoulders Pattern: The technical analysis identifies the formation of an inverted head and shoulders pattern on both the monthly and weekly time frames. This pattern is considered a bullish reversal pattern and suggests that the stock's downtrend might be reversing into an uptrend. The pattern consists of a central low point (the "head") flanked by two higher low points (the "shoulders"). This formation indicates a potential shift from bearish to bullish sentiment.
Trend Line Breakout: The analysis notes that the inverted head and shoulders pattern is accompanied by a breakout from a trend line. This breakout signifies a potential change in the stock's price trajectory and could be indicative of a new uptrend.
Volume Confirmation: The technical analysis highlights that the breakout from the trend line was accompanied by high trading volumes, which surpassed the average volumes observed thus far. Volume is an important confirmation factor in technical analysis, as it adds credibility to price movements and suggests strong market participation.
Weekly Closing Confirmation: The breakout from the trend line also occurred on a weekly basis, and the stock managed to close above this breakout level. Weekly closing prices are often considered more reliable indicators of trend changes compared to intraday or daily price movements.
Price Target: The analysis indicates that the price targets for potential gains are based on the size of the "head" of the inverted head and shoulders pattern. This is a common method to estimate potential price targets in this pattern.
In conclusion, the technical analysis of JP Power (jppower) indicates a multiple confirmation trade opportunity with a bullish bias. The convergence of positive technical factors, including the inverted head and shoulders pattern, trend line breakout, increased volumes, and weekly closing confirmation, suggests that the stock could be poised for an upward move. However, it's important to note that all trading and investment decisions should be made with thorough research and consideration of risk factors.

JPPOWER : Penny stock for long-term/short-mideterm investment#JPPOWER : Jaiprakash Power
Short Term - Midterm Swing Or Long Term stock
Chart Pattern : Rounding Bottom
CMP : 8.15
Safe ENTRY @10.30
Targets : 20, 26, 36
#DYOR

JPPOWER looks bullish on a daily TFIts been making rounding bottom and crawling upwards gradually.
Key level is 9. If it breaks that level with volume, it can reach level 11.
It it follows the trend, we can also see level 18 soon.
Below level 6 it would be weak.

JP POWER Swing and Medium Trend update#JPPOWER
CMP ₹ .8/-
Symmetrical Triangle Pattern Formed
If Break Out Above ₹ 8/- Swing Exit ₹ .10/-
Medium Exit ₹ 17 + + +
Risk Below ₹ . 6/-

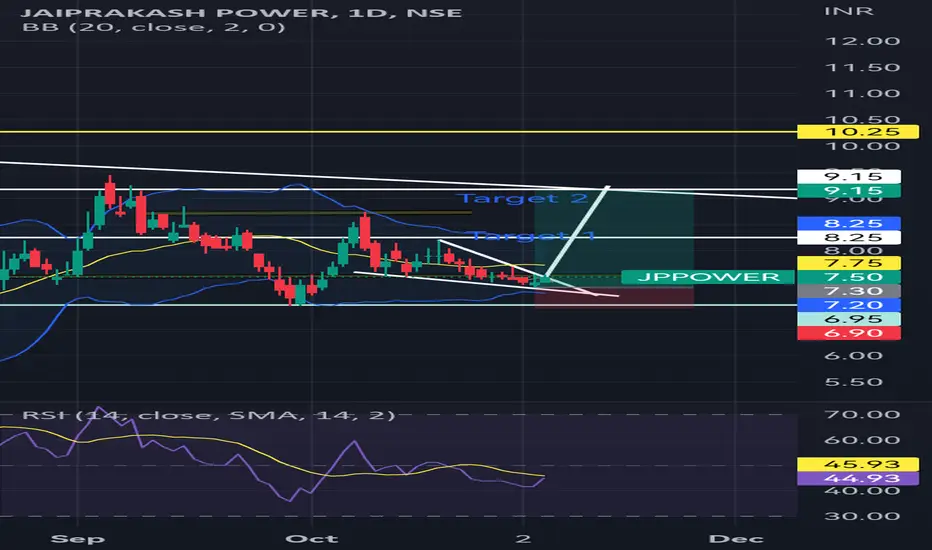
#JPpower seems to be bullish You can buy jppower at the rate of 7.60 with a Stop-loss 6.90 and target 1 8.25 and target 2 9.15 for short-term
This above information is for educational purposes only
JPPOWER Wait for Bulls & Trend ReversalThe idea here is about Jai Prakash Power Ventures:
Jai prakash Power Ventures Ltd. engages in the generation of power. It operates through the following segments: Power and Transmission, Coal, and Other. The Power and Transmission segment includes generation, sale, and transmission of power. The Coal segment refers to the coal mining for captive use in energy generation. The Other segment consists of cement grinding.
My view is short term bearish & long term Bullish for the below observed technical factors.
Points as per TA on a Monthly, Weekly & daily Chart:
1. Contracting or symmetrical triangle formation observed with ABCD completed and expected move towards E on Elliott’s triangle pattern on a weekly chart as per below:
2. Cup & Handle formation observed on a Monthly chart & under ranging market at the time of publishing as per below:
3. Bearish Anti Butterfly Harmonic pattern completed swing target 2: A Swing = 6.45 which is also contracting or symmetrical triangle support zone as per below:
4. Bullish Gartley Harmonic Pattern CD leg in progress, min & max XD distance on Fib is 0.786 for Gartley which is 6.30. Which is also approx to contracting or symmetrical triangle support zone & Target 2 on Bearish Anti Butterfly Harmonic Pattern as per below:
5. Possible Inverse Head & Shoulder Pattern observed & price to be rejected @ 8.50 due to resistance zone & Bearish Anti Butterfly B point on a weekly chart as per below :
6. Elliott’s Bullish triangle ABCD points completed and Price direction towards E point on a weekly chart as per below:
7. Possible Head & Shoulder pattern observed on daily chart with support zone @ 6.75 as per below:
8. Trading way above 20 & 200 EMA on a weekly chart & 20 EMA cross over expected soon.
9. Trading above 200 EMA & 20 EMA Support on weekly chart.
10. Ichimoku Cloud analysis: Kumo Breakout & Kumo Twist on a daily & weekly is strong uptrend & monthly chart is consolidating at the time of publishing.
11. RSI is at 54.17 on a weekly Chart and 49.44 on daily chart at the time of publishing.
12. MACD above signal line on weekly & daily chart, However it is converging towards signal line on weekly chart.
13. Hull Moving average on daily is a sell and other moving averages on weekly & monthly chart is a strong buy.
14. ADX ( Average directional index ) trend strength is at 23.43 on a weekly & 11.70 on daily chart, which indicates a absent or weak trend ( ADX between 0-25 is a Absent or weak trend).
Projected Target with %: Wait for bulls to take over once the price hits 6.60 to 6.45 and enter long since the Risk to Reward looks damn good(Final % provided in chart), since the Earnings report which was on 22nd Oct 2022, looks good this week will give more clarity on Entry points,
Stop Loss: Entry only once we have confirmation for long.
Note: Any dip can be considered as accumulation.
Disclaimer: “The above is an Educational idea only and not any kind of financial or investment advice. So please do your own DD (Due Diligence) before any kind of investment”.
Do you like my TA & ideas!!
Want to keep yourself updated with current market action? Then don’t forget boost & to subscribe for more analysis.
Do leave your valuable feedback & comments for any improvisations.
Cheers.
