TCS – Momentum Shifting Upwards?1. Key Zones
Demand Zone: ₹2,850 – ₹3,000
Supply Zone: ₹3,600 – ₹3,720
2. Structure
Price has bounced strongly from the major weekly demand zone.
The descending trendline is broken, indicating a potential shift in momentum.
Price is now retesting the breakout zone for support.
3. Possible Move
If
Key facts today
Next report date
—
Report period
—
EPS estimate
—
Revenue estimate
—
136.65 INR
485.53 B INR
2.55 T INR
1.02 B
About Tata Consultancy Services Limited
Sector
Industry
CEO
Kunchitham Krithivasan
Website
Headquarters
Mumbai
Founded
1968
ISIN
INE467B01029
FIGI
BBG000Q0WGC6
IPO date
Aug 25, 2004
IPO offer price
18.32 USD
Tata Consultancy Services Limited (TCS) is engaged in providing information technology (IT) services, digital and business solutions. The Company's segments include banking, finance and insurance services (BFSI); manufacturing; retail and consumer packaged goods (CPG); telecom, media and entertainment, and others, such as energy, resources and utilities, hi-tech, life science and healthcare, s-Governance, travel, transportation and hospitality, and other products. Its services portfolio consists of IT and assurance services, business intelligence and performance management, business process services, cloud services, connected marketing solutions, consulting, engineering and industrial services, enterprise solutions, IT infrastructure services, mobility products and services and platform solutions. Its software offerings include Digital Software and Solutions, TCS BaNCS and TCS MasterCraft, among others. It serves industries, including insurance, healthcare, retail, telecom and others.
Related stocks

#TCS more panic on card!!We are bearish on few IT Stocks, especially #TCS and have been selling this year, Now once again we are adding fresh sell of TCS at 3195 levels for more panic!!

TCS: SMA 200 for long positionHello traders,
The stock we are going to watch is $NSE:TCS. This stock is related to IT sector. This stock is mostly moving in an upward direction. Currently, it is taking some additional support of SMA200 in 4h time frame. This stock can shoot upwards at anytime.
If you're a option trader, consid

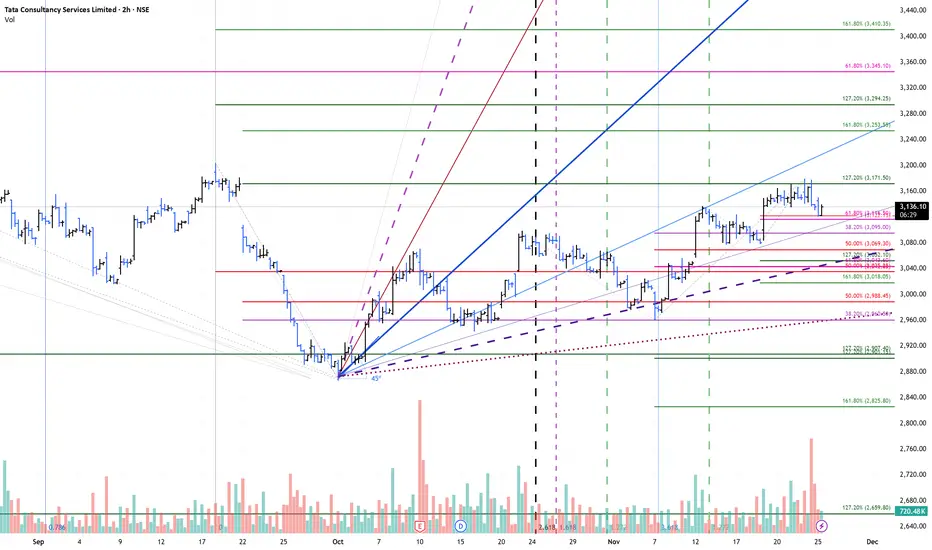
TCS - 2hour Chart with Price Cluster levels to watch .TCS - 2 hour chart price cluster level along with GANN Fans, initial reaction back down from extension.
TCS 4 hr chart view | Channel line | reaction @ 1.618"TCS - 4-hour view: Price is reacting to the downside from the top of the channel, as well as the short-term 1.1618 extension, where many moves tend to temporarily reverse. I’m watching for the next pullback to see if it can hold the symmetry and break higher, or if it will break the symmetry to the


TCS - Daily view - continue to scroll !TCS - Daily view - continue to scroll ! ; monitoring to check if it continue to build base from here ?

TCS | Risk-Takers Buy @LTP or Safer Entry above @3192TCS | Risk-Takers Buy @LTP or Safer Entry above @3192 | SL below 3060 | 1st Target 3500
Disclaimer (Please Read Carefully):
This is not investment advice. The stocks shared here are purely for educational and informational purposes. Please do your own research or consult with a financial advisor

Tcs - Poised for a Steady UpmoveAfter a long correction phase , TCS seems to be resting around its primary support zone , validation which , will move towards retesting it's All time Highs.
One must also keep in mind about the current macro factors in picture before taking a position in this. Trade with SL :)

TCS Hourly Trend AnalysisAs per technical study and price patterns and timing methods, I expect TCS to take a strong bull move towards the resistance of 3273. Increasing volume supports this bull trend till November 17, 2025.
There may be a possibility of profit booking post Nov 17.
This is my personal view based on my an

See all ideas
Summarizing what the indicators are suggesting.
Neutral
SellBuy
Strong sellStrong buy
Strong sellSellNeutralBuyStrong buy
Neutral
SellBuy
Strong sellStrong buy
Strong sellSellNeutralBuyStrong buy
Neutral
SellBuy
Strong sellStrong buy
Strong sellSellNeutralBuyStrong buy
An aggregate view of professional's ratings.
Neutral
SellBuy
Strong sellStrong buy
Strong sellSellNeutralBuyStrong buy
Neutral
SellBuy
Strong sellStrong buy
Strong sellSellNeutralBuyStrong buy
Neutral
SellBuy
Strong sellStrong buy
Strong sellSellNeutralBuyStrong buy
Displays a symbol's price movements over previous years to identify recurring trends.
Curated watchlists where TCS is featured.

Indian stocks: Racing ahead
46 No. of Symbols
See all sparks
Frequently Asked Questions
The current price of TCS is 3,188.10 INR — it has decreased by −0.87% in the past 24 hours. Watch Tata Consultancy Services Limited stock price performance more closely on the chart.
Depending on the exchange, the stock ticker may vary. For instance, on NSE exchange Tata Consultancy Services Limited stocks are traded under the ticker TCS.
TCS stock has risen by 2.47% compared to the previous week, the month change is a 6.91% rise, over the last year Tata Consultancy Services Limited has showed a −27.97% decrease.
We've gathered analysts' opinions on Tata Consultancy Services Limited future price: according to them, TCS price has a max estimate of 4,810.00 INR and a min estimate of 1,950.00 INR. Watch TCS chart and read a more detailed Tata Consultancy Services Limited stock forecast: see what analysts think of Tata Consultancy Services Limited and suggest that you do with its stocks.
TCS stock is 1.48% volatile and has beta coefficient of 1.08. Track Tata Consultancy Services Limited stock price on the chart and check out the list of the most volatile stocks — is Tata Consultancy Services Limited there?
Today Tata Consultancy Services Limited has the market capitalization of 11.72 T, it has decreased by −0.03% over the last week.
Yes, you can track Tata Consultancy Services Limited financials in yearly and quarterly reports right on TradingView.
Tata Consultancy Services Limited is going to release the next earnings report on Jan 15, 2026. Keep track of upcoming events with our Earnings Calendar.
TCS earnings for the last quarter are 33.37 INR per share, whereas the estimation was 34.77 INR resulting in a −4.02% surprise. The estimated earnings for the next quarter are 35.53 INR per share. See more details about Tata Consultancy Services Limited earnings.
Tata Consultancy Services Limited revenue for the last quarter amounts to 657.99 B INR, despite the estimated figure of 653.39 B INR. In the next quarter, revenue is expected to reach 670.89 B INR.
TCS net income for the last quarter is 120.75 B INR, while the quarter before that showed 127.60 B INR of net income which accounts for −5.37% change. Track more Tata Consultancy Services Limited financial stats to get the full picture.
Tata Consultancy Services Limited dividend yield was 1.66% in 2024, and payout ratio reached 44.71%. The year before the numbers were 1.42% and 43.69% correspondingly. See high-dividend stocks and find more opportunities for your portfolio.
As of Dec 10, 2025, the company has 607.98 K employees. See our rating of the largest employees — is Tata Consultancy Services Limited on this list?
EBITDA measures a company's operating performance, its growth signifies an improvement in the efficiency of a company. Tata Consultancy Services Limited EBITDA is 688.67 B INR, and current EBITDA margin is 26.49%. See more stats in Tata Consultancy Services Limited financial statements.
Like other stocks, TCS shares are traded on stock exchanges, e.g. Nasdaq, Nyse, Euronext, and the easiest way to buy them is through an online stock broker. To do this, you need to open an account and follow a broker's procedures, then start trading. You can trade Tata Consultancy Services Limited stock right from TradingView charts — choose your broker and connect to your account.
Investing in stocks requires a comprehensive research: you should carefully study all the available data, e.g. company's financials, related news, and its technical analysis. So Tata Consultancy Services Limited technincal analysis shows the buy rating today, and its 1 week rating is sell. Since market conditions are prone to changes, it's worth looking a bit further into the future — according to the 1 month rating Tata Consultancy Services Limited stock shows the neutral signal. See more of Tata Consultancy Services Limited technicals for a more comprehensive analysis.
If you're still not sure, try looking for inspiration in our curated watchlists.
If you're still not sure, try looking for inspiration in our curated watchlists.