Will the Weekly Bearish Divergence Play???KSE100
Is it Testing its Resistance again and Weakening this level? 😍
or
Making a Double Top? 🥺
I am anxiously waiting for the Break-Out : 73500 to Sustain
KSE100 trade ideas

KSe 100 short graph analysis.Market Update: 📊 The market recently breached the resistance zone at 72200-72700, edging towards its main resistance at 7300-73300. However, it faced rejection in this zone. Currently, ADX and DI+ are falling, while DI- is rising. If DI+ and DI- cross, and ADX continue to decline consistently, it may be prudent to consider profit-taking instead of buying. consider profit taking.
Strategy Adjustment: 🔄 Monitor closely for ADX and DI trends. If they indicate weakening bullish momentum and the market settles around 72100, it might be a good time to secure profits rather than initiate new positions. Stay vigilant for further market developments. Best of luck with your trades! 💪📉.

Market Analysis for KSE 100 Index 📈📉💹 (6 MAY 2024)Recent Trends:
KSE 100 recently saw a downturn, shedding 2500 points over a couple of bearish sessions.
However, the latest session witnessed a bullish surge, adding 1200 points in a single day.
Technical Indicators:
Bullish reversal harmonic pattern and a bullish flag formation suggest a target of 74500.
RSI indicates bullish divergence and is now in sync with the index.
Upcoming Forecast:
The next 2-4 days are crucial; a break above 73300 with a new higher high (HH) and no bearish divergence could signal a bullish market.
Strong resistance zones at 72300-72600 and 73000-73500 must be surpassed for further upward movement.
Beware of the bearish rising wedge pattern; if RSI shows bearish divergence and meets resistance at these zones, a bearish trend may emerge.
Trading Strategy: 📊💼
Trade conservatively with low quantity.
Consider profit-taking by selling on the higher side.
Watch market behavior closely and adapt strategy accordingly. 🧐
Stay vigilant and good luck with your trades! 🚀🌟

KSE100 in bullish trend KSE100 in Bullish trend, Three black crows seen on the chart most likely a trend reversal can be seen in the coming days.


Kse 100 Analysis.Over the last two working days, the KSE 100 index has undergone two bearish sessions. It is anticipated to encounter substantial support soon, likely around the Fibonacci 0.382 level, coinciding with the trend line between 70,700 and 70,800. Should this support level be breached, the next probable support is projected at 70,000. The Relative Strength Index (RSI) on the shorter timeframe is currently in the oversold territory, while the Average Directional Index (ADX) on the daily chart continues to indicate strength. The bearish pattern on the 1-hour chart suggests a falling wedge with a target of 70,500, implying that the market may decline by approximately 500-600 points but is expected to recover shortly thereafter.
try to buy your shares at the levels you find out cz share prices are at very discounted prices.Start gradual buying.

kse 100Kse 100 bullish pattern looks like it will go abv 72000 if breaks 71840 and form a candle abv that in 15 mins

KSE100 - 1D - Bullish Flag - 80,000 Points TPIn the KSE100 index we are observing a Bullish Flag on Daily Chart we can Expect a Rally towards 80,000 points.
80,000 Points target will be hit in the mid or end of July 2024

KSE100 | Double Top OR Break Out?The KSE 100 Index concluded its most recent trading session at 66,570, registering a gain of 663.7 points (1.01%). Presently, the index has breached its trend line and is encountering resistance from its new all-time high at 67,093. This level has the potential to form a double top pattern, indicating a possible rejection. However, a break above this level could signify the onset of a new bullish market cycle.

KSE100 LongKSE 100 Index making inverse H&S (completion is Due) .If IMF news comes in favour we are likely to have a swing for All time High. However it is crucial level as market is just wating for some fuel it could be IMF news, Interest rates.
Blue Chip Share should be accumulated at this point.

KSE 100 Index analysisPakistan is currently in discussions regarding the final tranche of the IMF loan and the potential acquisition of a new loan through the Extended Fund Facility (EFF). As the country wraps up the IMF review process, recent developments in inflation, reaching 23.06% year-on-year as of February 2024, have intensified discussions around key monetary policy decisions and the terms of the IMF deal.
Given the prevailing inflationary pressures, it's unlikely that the central bank will opt for a rate cut to address inflation until it's under control. The interest rate serves as a pivotal tool in managing the country's inflation dynamics. Looking ahead, expectations are set for a reduction in the CPI inflation rate to 20% by March 2024. This anticipated moderation could pave the way for a potential decrease in the monetary policy rate during the subsequent Monetary Policy Committee (MPC) meeting slated for April 29, 2024.
Should inflation align with projections and the monetary policy rate sees a reduction in the upcoming meeting, it could indicate a positive sentiment in the Pakistan Stock Exchange market, charting a positive trajectory forward. 📊🚀

KSE100 backing steps for a big jump towards 70K+ regionKSE 100 is currently in short term correction to step back for a jump towards 70K+ region and then move towards 78K target.

KSE100 Index Set To RetraceThe KSE100 Index is currently exhibiting a trend rejection, evident from its recent performance, particularly in the last two trading sessions characterized by lackluster volume and a decline in the index value. Consequently, a further downward movement is anticipated. In light of this observation, it is advisable to capitalize on profits by liquidating positions in stocks acquired during dips. Additionally, investors may contemplate acquiring shares at lower prices to optimize their average cost in the event of a subsequent rebound. Notably, the support level for the index is situated around 64,800, and its ability to maintain this level is crucial for initiating a potential recovery. Recommended stocks which can be accumulate on dip are DGKC, MLCF, PRL, ATRL, HCAR, EFERT, KEL, PPL, OGDC, PSO, FFC, SYS, FCCL, POL, MTL & HUBC.
Soon an update on the above scripts will be posted. Keep connected!
Thank you for reading.
If you boost, I know you enjoyed the content and I can continue to publish more.
Feel free to follow.
Thanks a lot for your support.
Assalam O Alikum.
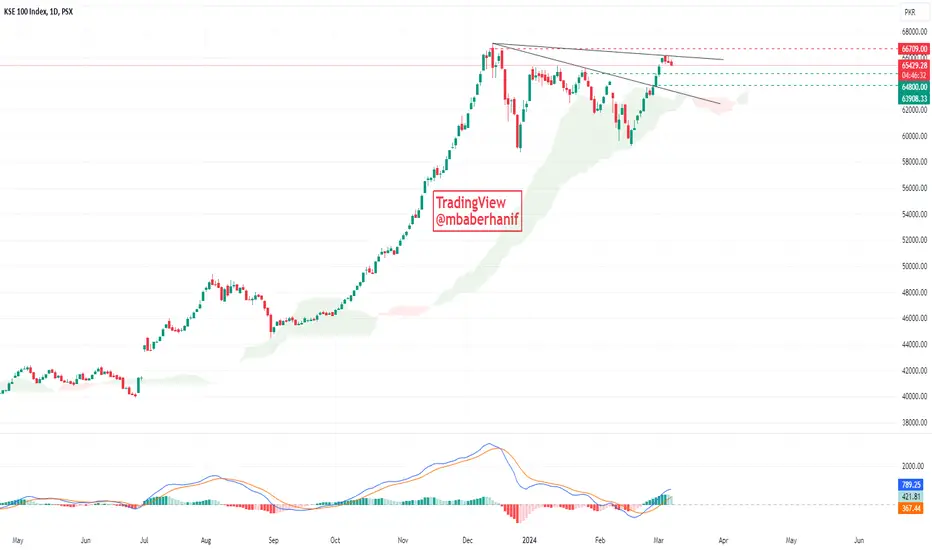
KSE100The KSE 100 Index closed its latest trading session at 63,704, marking a notable gain of 484.4 points (0.77%). Currently, the index breaks its descending trend line, with initial resistance observed at 64,196; surpassing this level may prompt a test of secondary resistance near 65,200. Vigilance regarding stop-loss levels is advisable. Conversely, a closure below 61,650 could instigate downward momentum.

KSE100 IndexThe KSE 100 Index closed its latest trading session at 63,306, marking a notable gain of 490 points (0.78%). Currently, the index is testing its descending trend line, with initial resistance observed at 64,196; surpassing this level may prompt a test of secondary resistance near 65,200. Vigilance regarding stop-loss levels is advisable. Conversely, a closure below 61,650 could instigate downward momentum.

𝐓𝐡𝐞 𝐊𝐒𝐄𝟏𝟎𝟎 𝐢𝐧𝐝𝐞𝐱 𝐢𝐬 𝐛𝐮𝐥𝐥𝐢𝐬𝐡𝐓𝐡𝐞 𝐊𝐒𝐄𝟏𝟎𝟎 𝐢𝐧𝐝𝐞𝐱 𝐢𝐬 𝐢𝐧 𝐛𝐮𝐥𝐥𝐢𝐬𝐡 𝐬𝐭𝐚𝐭𝐮𝐬 𝐧𝐨𝐭𝐡𝐢𝐧𝐠 𝐭𝐨 𝐰𝐨𝐫𝐫𝐲 𝐟𝐨𝐫 𝐦𝐞𝐝𝐢𝐮𝐦 𝐭𝐞𝐫𝐦 𝐬𝐜𝐞𝐧𝐚𝐫𝐢𝐨.
In short-term scenario (Q1-Q2, 2024) 𝐊𝐒𝐄 𝐢𝐧𝐝𝐞𝐱 𝐢𝐬 𝐢𝐧 𝐢𝐭𝐬 𝐂𝐑𝐓𝐈𝐂𝐀𝐋 𝐀𝐑𝐄𝐀, if it sustains above the critical area it will definitely go up towards the new all time high milestone.
𝐴𝑙𝑡ℎ𝑜𝑢𝑔ℎ 𝑖𝑡 ℎ𝑎𝑠 𝑓𝑢𝑙𝑓𝑖𝑙𝑙𝑒𝑑 𝑡ℎ𝑒 𝑚𝑖𝑛𝑖𝑚𝑢𝑚 𝑟𝑒𝑞𝑢𝑖𝑟𝑒𝑚𝑒𝑛𝑡 𝑓𝑜𝑟 𝑐𝑜𝑟𝑟𝑒𝑐𝑡𝑖𝑜𝑛 𝑖𝑛 𝑡𝑒𝑟𝑚𝑠 𝑜𝑓 𝑣𝑎𝑙𝑢𝑒 𝑎𝑠 𝑤𝑒𝑙𝑙 𝑎𝑠 𝑡𝑖𝑚𝑒, but if it could not sustain above the critical area, then it might 𝐠𝐨 𝐝𝐨𝐰𝐧 all the way between 𝟓𝟓𝐊 - 𝟓𝟕𝐊 or in more severe conditions 𝟓𝟏𝐊 - 𝟓𝟓𝐊.
In my view it would not go very deep down below 55K, however sustainability over critical area is very important.
I hope that the 𝒔𝒖𝒄𝒄𝒆𝒔𝒔𝒇𝒖𝒍 𝒅𝒆𝒗𝒆𝒍𝒐𝒑𝒎𝒆𝒏𝒕 𝒐𝒇 𝒏𝒆𝒘 𝒈𝒐𝒗𝒆𝒓𝒏𝒎𝒆𝒏𝒕 𝒊𝒏 𝒄𝒐𝒎𝒊𝒏𝒈 𝒅𝒂𝒚𝒔 𝒔𝒉𝒐𝒖𝒍𝒅 𝒔𝒖𝒑𝒑𝒐𝒓𝒕 𝒊𝒏𝒅𝒆𝒙 𝒖𝒑𝒘𝒂𝒓𝒅 𝒎𝒐𝒗𝒆𝒎𝒆𝒏𝒕.
Therefore, 𝒄𝒂𝒓𝒆𝒇𝒖𝒍 𝒊𝒏𝒗𝒆𝒔𝒕𝒎𝒆𝒏𝒕 𝒘𝒊𝒕𝒉 𝒑𝒓𝒐𝒑𝒆𝒓 𝒓𝒊𝒔𝒌 𝒎𝒂𝒏𝒂𝒈𝒆𝒎𝒆𝒏𝒕 𝒘𝒊𝒍𝒍 𝒃𝒆 𝒕𝒉𝒆 𝒌𝒆𝒚 𝒇𝒐𝒓 𝒔𝒖𝒄𝒄𝒆𝒔𝒔𝒇𝒖𝒍 𝒂𝒏𝒅 𝒑𝒓𝒐𝒇𝒊𝒕𝒂𝒃𝒍𝒆 𝒕𝒓𝒂𝒅𝒆𝒔.

KSE-100 - Multi-year H&S playing outThis looks like a multi year bull run in the making .... publishing this idea so I can track it down the line.

KSE100 is BullishKSE-100 is currently in a corrective mode, after a momentous bullish rally. It could test the previously defined higher low around 59.5k mark. A successful retest would fuel a new rally that could take the index around 75k-78k. Important levels are mentioned on the chart.

KSE 100
Technically market is at its retest level of head and shoulder pattern and now it can go to 66542 which is next major resistance
By fibonacci level market is at 0.382 level from its last crash 58934 to its last high 65320 which is agood support

KSE100 TEST THE 0.382KSE100 here we can apply the fib to KSE100 and exactly yo 0.382 so according to fib it can bounce back to touch it new high. and break it previous high.

KSE100 -PSXKSE100 index is currently displaying a promising technical setup with the emergence of the ABCD pattern, finding support at the 0.38 Fibonacci retracement level, and no bearish divergence on the RSI indicator.

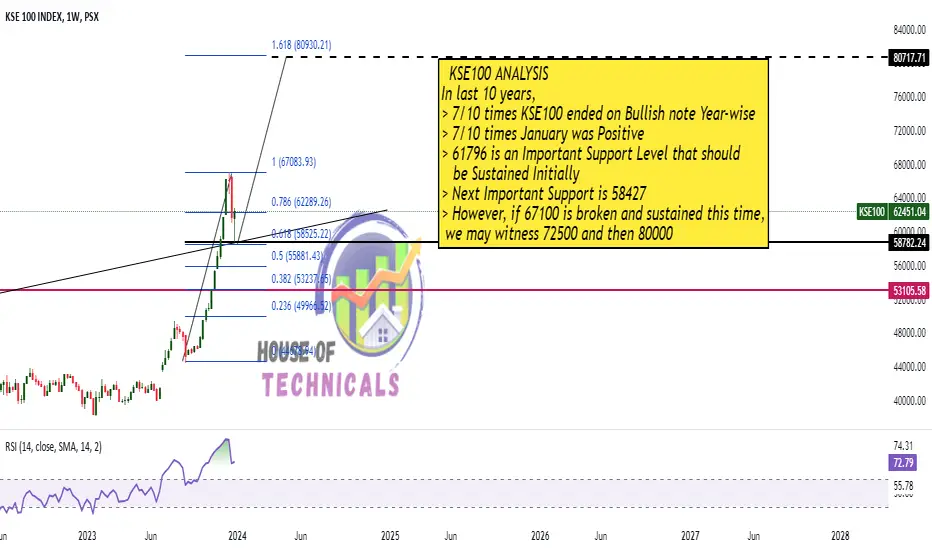
KSE100 KSE100 ANALYSIS
In last 10 years,
> 7/10 times KSE100 ended on Bullish note Year-wise
> 7/10 times January was Positive
> 61796 is an Important Support Level that should
be Sustained Initially
> Next Important Support is 58427
> However, if 67100 is broken and sustained this time,
we may witness 72500 and then 80000
KSE 100 is BullishKSE-100 is extremely bullish for 2024, specifically for the upcoming month of January 2024. There has been no divergence on the RSI, which is a classic indication of trend reversal, moreover the recent pull back is healthy as a new higher low is defined. In the coming weeks, market is more likely to recover and print new higher highs, breaking the previous all time high. The projection of AB=CD pattern indicates that the rally could continue till 80k. Targets are mentioned on the chart.
