Mari Petroleum - Preparing for Bearish Move- Price making HH's
-Rsi making LH's
-Volume making LH's
- Price is about to turn around for bearish move anytime.
MARI trade ideas

MARI Bearish DivergenceIn a Bullish Market, I observed Bearish Divergence on 1D Timeframe
Indicating reversal of price trend.
Accordingly, I planned sell stop trade at the breakout of HL.
Stop Loss was placed at the breakout of HH.

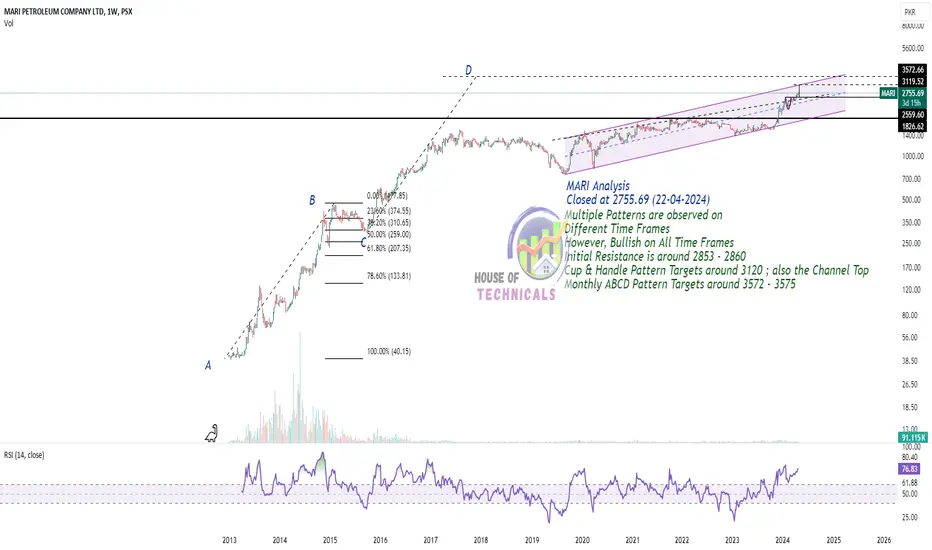
Bullish on All Time FramesMultiple Patterns are observed on
Different Time Frames
However, Bullish on All Time Frames
Initial Resistance is around 2853 - 2860
Cup & Handle Pattern Targets around 3120 ; also the Channel Top
Monthly ABCD Pattern Targets around 3572 - 3575
Week 2 Candle Stick Pattern Idea 1: MARI MARI offers traders compelling opportunities following distinct candlestick patterns, indicating potential bullish movements in the near term.
Trade Plan:
Entry Point 1:
Candlestick Pattern: Bullish Hammer
Entry Point: 1,588.7, following the formation of the bullish hammer candlestick pattern. This entry signifies a bullish reversal from the previous downward trend.
Stop Loss: Positioned at 1,540, serving as a protective measure against adverse price movements.
Take Profit (TP1): Targeted at 2,500, reflecting the initial profit-taking level with the potential for significant upside momentum.
Entry Point 2:
Candlestick Pattern: Tweezer Bottom
Entry Point: Identified at 2,202, subsequent to the formation of the tweezer bottom candlestick pattern. This entry suggests a confirmation of bullish sentiment, indicating a potential reversal from the recent downtrend.
Take Profit (TP2): 2,622, representing a higher profit target in anticipation of extended bullish movement following the tweezer bottom formation.

Week 1 Dow Theory Idea 4: MARI Week 1 Dow Theory Idea 4: MARI (Bullish/Long)
MARI continues to display bullish momentum, offering two distinct trade plans for investors to consider. Plan 1 has been executed, while Plan 2 presents an alternative entry opportunity for traders seeking to capitalize on the upward trend.
Plan 1:
Entry Point: Established at 1,717, this entry marks the initiation of a long position in alignment with the bullish sentiment observed in the chart.
Stop Loss: Positioned at 1,676, the stop loss serves to mitigate potential losses in the event of an adverse market reversal, preserving capital and managing risk effectively.
Take Profit (TP1): Targeted at 2,500, TP1 represents the initial profit-taking level, reflecting a significant upside potential in the bullish trend.
Plan 2:
Entry Point 2: Identified at 2,227, this entry offers an alternative opportunity for traders to enter the market, potentially capturing further gains as the bullish momentum continues.
Take Profit (TP2): Set at 2,622, TP2 represents a higher profit target, reflecting the anticipation of extended bullish movement in the price of MARI.

MARI - Long Based on the chart, it seems a bullish cup and handle trend is forming. The breakout level is at the blue line. If the stock happens to break that, it will be in a bullish trend.
Fundamentally, MARI is a good stock and current news are in favor as well. This is a long term holding stock.

PSX MARI - Bearish DivergenceBook profits as its going to make corrections.
Bearish Divergence FORMED

MARI - Making Bearish PatternMakinng Bearish Traingle Pattern - If it breaks Support its going to Fall.

Buy with stop loss on convincing closing below weekly trendlineBuy with stop loss on convincing closing below weekly trendline

MIRA - Bearish TrendMIRA is trading in Bullish Trend but on 3rd 4th and 5th July 23 MIRA make inside Bar (Bearish Candles stick) and on 11th to 13th July 23 make again Dark Cloud Cover (Bearish Candles stick) so trend will be change in LL and LW due to Bearish Candles stick.
