Tea cup/ Gold cup setup on XAGUSD (Silver)1. Order block with unbalanced fair trade gap identified in the green.
2. Wedge broken.
3. Price is anticipated to break 50 McGinley line average.
SILVER trade ideas

SILVER On The Rise! BUY!
My dear subscribers,
This is my opinion on the SILVER next move:
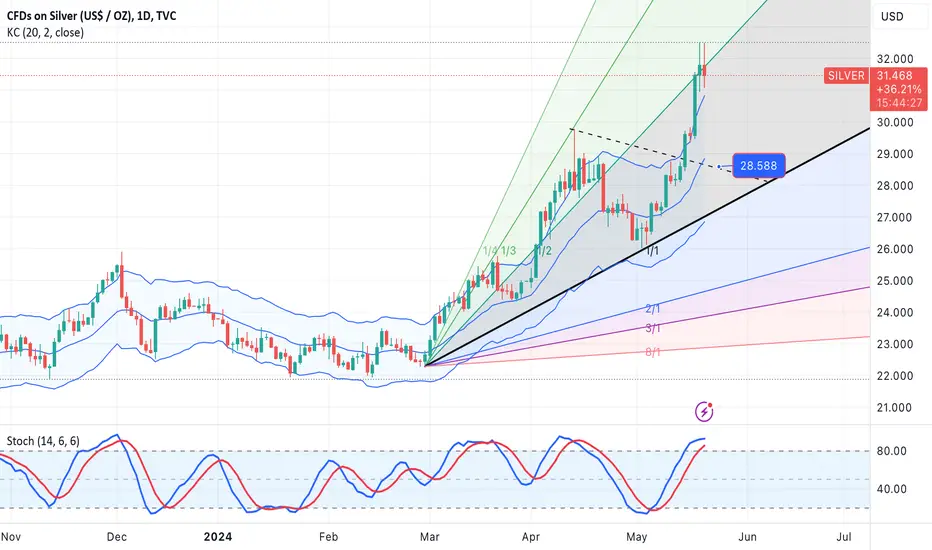
The instrument tests an important psychological level 30.4065
Bias - Bullish
Technical Indicators: Supper Trend gives a precise Bullish signal, while Pivot Point HL predicts price changes and potential reversals in the market.
Target - 31.0378
About Used Indicators:
On the subsequent day, trading above the pivot point is thought to indicate ongoing bullish sentiment, while trading below the pivot point indicates bearish sentiment.
———————————
WISH YOU ALL LUCK

XAGUSD upside target 34.0XAGUSD is currently maintaining a good upward trend, and bulls are performing strongly. At present, we can pay attention to the potential upward AB=CD pattern, with a target position of 34.0.

SILVER Swing Long! Buy!
Hello,Traders!
SILVER is going down
To retest the strong
Horizontal key level of 30.00$
Again and we are locally
Bullish biased so we
Will be expecting
A bullish rebound
Buy!
Like, comment and subscribe to help us grow!
Check out other forecasts below too!

SILVER: Weak Market & Bearish Forecast
Balance of buyers and sellers on the SILVER pair, that is best felt when all the timeframes are analyzed properly is shifting in favor of the sellers, therefore is it only natural that we go short on the pair.
❤️ Please, support our work with like & comment! ❤️

Silver Get ready for massive runSilver has been testing the pactience of investor community for a very long time. Known as a poor man's Gold this commidity mimicks the gold price but moves are sudden and strong. Gold has been in past 5 years moving within the range of triangle and getting into a squeeze period. looking for breskout upward and flow the Gold price move.

XAGUSDPair : XAGUSD ( Silver / U.S Dollar )
Description :
Double Top as an Corrective Pattern in Short Time Frame
Resistance Level
Break of Structure
RSI - Divergence
Completed " 12345 " Impulsive Waves

Inverted H&S' on Silver Chart2 Inverted Head & Shoulders - possible trend continuation until final target.

SILVER Will Fall! Short!
Please, check our technical outlook for SILVER.
Time Frame: 1D
Current Trend: Bearish
Sentiment: Overbought (based on 7-period RSI)
Forecast: Bearish
The market is trading around a solid horizontal structure 31.601.
The above observations make me that the market will inevitably achieve 27.300 level.
P.S
We determine oversold/overbought condition with RSI indicator.
When it drops below 30 - the market is considered to be oversold.
When it bounces above 70 - the market is considered to be overbought.
Like and subscribe and comment my ideas if you enjoy them!

Does silver correct?
Hello my dears
We are at your service with silver analysis. In the drawn diagram, we considered 3 goals that there is a possibility of seeing these goals in the future.
There are 9 black dotted lines that are placed as resistance in the way of candles. We want to check the reaction of silver price when reaching these diagonal resistance levels.
If you like my analysis, support me with likes and comments. thank you

Silver International : Entering Buy Zone . Silver 60 Min chart is in Downtrend at 80 Degree slope (Sign of Reversal at Support zone)
Entering Buy Zone .
Waiting for Price Pattern to Change HH-HL
and candlestick Green.

silver vs spx weeklyHere's the setup for #silver to run up over 50% in a few months and recapture the mythical 50$ mark.

Double Top on XAG/USD @ D1This double top pattern has formed on the daily chart of the XAG/USD pair (Silver) following a rather long bullish trend. It can be used as a downside breakout setup. The two tops are marked with the upper yellow line; the neckline is marked with the lower yellow line. My potential entry level is at the cyan line (10% of the pattern's height below the neckline). My potential take-profit level is at the green line (100% of the pattern's height below the neckline). My potential stop-loss is not shown on the chart and will be set to the high of the breakout candle or to the high of the preceding candle if the breakout one trades mostly outside the pattern's borders. I won't be trading a bullish breakout from this trend-reversal pattern.

Silver moving aggressively Silver has started to move aggressively. Interesting to note that it’s when the US markets are closed and it’s the evening in Asia.

SILVER-SELL strategy Daily chartNo change in view. We are very overbought for SILVER and one can observe the GOLDSILVER RATIO chart cleary identifying we should see a big drop of the precious metal.
I feel we may see test of $ 28.50 area.
Strategy SELL @ 31.50-31.85 and place SL above 32.78 and take profit near $ 28.90.
SILVER (XAGUSD): End of Correction?! 🪙
Silver formed 2 bullish patterns on an hourly time frame
after a correctional movement.
I see a tiny double bottom formation and a falling wedge pattern.
Neckline / trend line of both patterns were broken.
We might see a bullish movement today.
At least to 30.9
❤️Please, support my work with like, thank you!❤️

Silver Prices Poised for Bullish Rise as Key Indicators AlignHello there,
Technical Outlook:
Silver prices have been hovering above the 29.982 mark, and need a close watch over the RSI for signs of a potential bullish trend. If the silver price manages to pull above the RSI moving average and surpass the 50 level, it could signal a proper bullish rise soon.
The current market conditions have also challenged the Elliott Wave theory's fourth wave, which suggests that the price may be consolidating before a potential upward move. The 72-day exponential moving average (72 DEMA) is another key indicator that suggests an overall bearish market, so it's a high-risk setup.
Fundamental Summary:
Silver prices are up 1.5% to $30.58 per ounce.
The outlook for silver is uncertain due to the Federal Reserve's plans to raise interest rates.
The US economy is looking strong, which could affect silver prices.
Investors are watching the US dollar and a key economic indicator called durable goods orders.
The overall outlook is uncertain, but silver prices are currently up 20% since the start of the year
Happy Trading,
K.

Silver uptrend intact & looking good!After overcoming resistance at $34/$34, the next stop is $50 where a substantial correction should take place.

XAGUSD Possible to Reach $300 to $400. Channel Top.Silver / U.S.Dollar is Possible to Reach Channel Top, if it Breakout above the Resistance level. One of the main reason is that Resistance level Breakout after 44-years. So Expect Wild movement in a Bullish Trend.
Target is the Channel Top, and the Price is $300 to $400 Dollar, it depends on the Time.
I want to help people to Make Profit all over the World.

Primary count remains this one...last one was bearish alternateI still remain boolish... but want to make sure we are all aware of bearish alternate counts....this is my primaryt count for silver.

Strifor || SILVER-23/05/2024Preferred direction: BUY
Comment: After yet another historical and local record for metals , this market began to correct faster than currency pairs. In silver , in particular, we have recorded a local maximum and are now confidently moving towards the support level of 29.77800 . Near this level, we consider long according to scenario №1 , taking into account the context. We also do not exclude scenario №2 , which involves buying at the 29.00 level. In both cases, we do not consider the target above the level of 31.80 , where this correction started.
Additional comments on this trade will be provided as situation changes. Follow us!
Thank you for like and share your views!

XAGUSD SELL Could this be a possible selling zone for Silver?
The RSI is showing that the market has reached maximum buying area.
The 4HR is also showing a reversal chart pattern at the current zone, we could possibly see selling pressure coming in.
Let's see how this will play out

XAGUSD. Weekly trading levels 3 - 7.06.2024During the week you can trade from these price levels. Finding the entry point into a transaction and its support is up to you, depending on your trading style and the development of the situation. Zones show preferred price ranges WHERE to look for an entry point into a trade.
If you expect any medium-term price movements, then most likely they will start from one of the zones.
Levels are valid for a week, the date is in the title. Next week I will adjust the levels based on new data and publish a new post.
! Please note that brokers have a difference in quotes, take this into account when trading.
The history of level development can be seen in my previous posts. They cannot be edited or deleted. Everything is fair. :)
----------------------------------------------
I don’t play guess the direction (that’s why there are no directional arrows), but zones (levels) are used for trading. We wait for the zone to approach, watch the reaction, and enter the trade.
Levels are drawn based on volumes and data from the CME. They are used as areas of interest for trading. Traded as classic support/resistance levels. We see the reaction to the rebound, we trade the rebound. We see a breakout and continue to trade on a rollback to the level. The worst option is if we revolve around the zone in a flat.
Do not reverse the market at every level; if there is a trend movement, consider it as an opportunity to continue the movement. Until the price has drawn a reversal pattern.
Don't forget to like Rocket and Subscribe!!! Feedback is very important to me!
