SHORTThis analysis is based on price and time expansion.
We have three time points defining an alternate time relationship for (top-to-top) or (top to bottom)
This time expansion alternating between tops and bottoms also puts the next point on 26th August 2024 weekly candle.
We also have a time projection on 10th June 2024 weekly candle(+/-1) where we expect markets to top.
That gives us a timezone between 10th June to 26th August 2024 to expect a heavy market reaction.
The two indicated times 965 and 685 days have a Phi relation of 3 : 2
341.2 x 1.4142 x 1.4142 = (341.2 x 2) = 682.39 units
341.2 x 1.4142 x 1.4142 x 1.4142 = (341.2 x 2(Root 2)) = 965.03 units
To narrow the time zone down we will need to align that with price expansion.
The current cycle unfolding is the ending part of the 20-year cycle with its origin at the 07/10/2002 bottom. Considering the March 2009 bottom as the actual low of this cycle we would expect a 4669.47 points advance from 666.79 to complete a Phi³ price expansion, where Phi = 5/3 = 1.667 and unit value = 1008 units.
That is:
666.79 + (1008 x 1.667³) = 5336.26
Current top = 5341.88 = 5336.28 + (5.6 pts)
The progression of the Phi Expansion from 666.79 price level:
666.79 + (1008 x 3/2) = 2178.79
666.79 + (1008 x 1.667) = 2347.13
Second Phi Expansion
666.79 + (1008 x 1.667²) = 3467.91
Third Phi Expansion
666.79 + (1008 x 1.667³) = 5336.26
The progression of tops and bottoms furnish us with two projections
1. Since the Phi points are all bottoms, price can advance about 1540 points off 5336.26 and the correction that will follow will rather end at 5336.26. That will put the top at (5336.26 + 1540) = 6876.26 price level. This top has no relation to the two projected dates on the chat.
2. Cycle expansions usually terminate at cubic Phi progression, that is (Unity x Phi³). So the third expansion will actually be a mid-cycle top which will effect a minor correction.The base of this correction will be the bottom for an advance towards 6876.26 level
From the above, any short entries should have tight stop levels
Please check back as we break the analysis further down to the daily and hourly sub cycles.
Trade safe, goodluck
SPXM trade ideas

SPX500, a new ATH?! After finding a new ATH on Thursday May 23, the price of the S&P500 fell by 2%.
I remain long on the SPX500.
A nice bullish setup has taken shape:
Back in the OTE zone
Rebound on H1 Order Block
I think a new ATH is quite feasible over the next few days/weeks.
Feel free to subscribe and put a boost on this post if you enjoyed my analysis, and tell me what you think!
Happy trading and a great week :)

SPx (Near to the another new record)SPx New Forecast
The price of the S&P 500 reached the resistance line, and breaking this resistance, will support the price to reach the next resistance line which is 5350,
If the price remains below 5305 and 5320, it will likely fall back to the support line at 5266. Breaking this level could extend the bearish trend towards 5226.
Pivot Line: 5305
Resistance Levels: 5325, 5350, 5400
Support Levels: 5266, 5227, 5193
Today’s expected trading range is between the support 5266 and the resistance 5350.

Hindenburg Crash Signal on US Stock Market Triggered !Throughout history, major crashes in the US stock market
have been proceeded by a Sell Signal in a technical indicator
known as the "Hindenburg Omen"
Last week, the "Hindenburg Omen" triggered a potential crash signal on the market
based on the 4 criteria of volume,volatility, momentum, and trend indicators that it follows.
The McClellan Oscillator's NYSE move below the "zero "line last week,
triggered the new potentially ominous signal.
Traders are advised to be aware of the current deterioration of technical strength
in the market, being masked or disguised by "moon shot" stocks like Nvidea.
Market Vane's Bullish Percentage at 69% latest reading shows how super bullish the crowd is.
There is almost no fear that the stock market could crash.
Ask yourself...Do you know "any" traders thinking about that possibility.. right now ..?
THE_UNWIND
Woods Of Connecticut
5/29.24

Tops Not In...I see a lot of fear in markets and many thinking a top may be in...I really struggle seeing how for many reasons and I think we got more up left till this party ends.

SPx (US Futures Dip Ahead of PCE Data with Technical) US Futures Dip Ahead of PCE Data
US stock futures edged lower on Friday as investors braced for the April PCE price index report, the Federal Reserve's preferred inflation gauge.
Technical Analyse:
The price dropped by approximately 0.27% from yesterday and reached our target, as mentioned in the previous analysis.
For today, the price is expected to move between 5240 and 5220 until a breakout occurs. Bearish pressure remains , and stability below 5220 will likely support a further decline to 5192, with 5168 as the next target. Conversely, stability above 5240 will suggest an attempt to reach 5260.
Pivot Line: 5226
Resistance Levels: 5260, 5284, 5320
Support Levels: 5193, 5168, 5114
Today’s expected trading range is between the support at 5168 and the resistance at 5262.
previous idea:

SPX Is Going Down! Sell!
Here is our detailed technical review for SPX.
Time Frame: 1D
Current Trend: Bearish
Sentiment: Overbought (based on 7-period RSI)
Forecast: Bearish
The market is testing a major horizontal structure 5,304.15.
Taking into consideration the structure & trend analysis, I believe that the market will reach 5,178.42 level soon.
P.S
The term oversold refers to a condition where an asset has traded lower in price and has the potential for a price bounce.
Overbought refers to market scenarios where the instrument is traded considerably higher than its fair value. Overvaluation is caused by market sentiments when there is positive news.
Like and subscribe and comment my ideas if you enjoy them!

SP500 Short trading opportunity(day-to-overnight-trading) 1I expect a drop of about 20+- points all the way down to 5295 from 5310+-
Stop Loss 5322+-, take profit is 5295+-.
I am risking nothing but if I had not traded today I would possibly have risked 1 unit of the Micro E-mini S&P 500 Index Futures (MES).

The correction down for SPX500USD has startedHi traders,
Last week SPX500USD went up a little more but dropped on Thursday just like I've said in the outlook last week. So now the correction has started we have to wait for the finish of it.
Trade idea: Wait for the finish of a correction down to trade longs.
If you want to learn more about wave analysis, please make sure to follow me, give a like and respectful comment.
This shared post is only my point of view on what could be the next move in this pair based on my analysis. I do not provide signals.
Don't be emotional, just trade!
Eduwave

S&P 500 CUP & HANDLEHello Traders and welcome! Let's take a look at the S&P 500 today.
The price has formed a cup and handle on its weekly chart, successfully breaking above the breakout level of 4815.92. Levels to consider are 38%: 5325.92, where partial profit could be taken, and this level might be used as support in the near future. Further targets are 62%: 5634.84 and 79%: 5857.40.


FewEveryone senses there is something coming, but nobody knows what it is. Regardless the markets will correct massively, technically because we haven't had a 0.61 fib correction in a decade, secondly because the bags are too heavy and everyone is bagholding, we need to shake those who call themselves diamond hands at +50% price discounts, i.e. cheaper prices.
Capital is excessively cheap, Attention is overpriced. Manual Labor is underpriced we are living in a bubble state, some call it 'the everything bubble'.
Call me bubble boy, chicken little, i don't care.
A Nuke is coming.

The End & The BeginningThis will be our final public post
The collapse of modern society and capitalism has begun
We must focus on preparation
May you all be safe

Do you think this path will happen for SPx500?Hello Dears
Stay with me by analyzing stock charts
After the strange growth of stocks, the correction in the coming days does not seem too unrealistic.
In my analysis, I used light black dotted lines, which are high in number because I want to see the reaction of the candles to these resistance areas together.
I considered three goals, of course, I set a loss limit with high confidence that if the price reaches that level, we should wait for the growth of the stock price.
Comment your opinion
Don't forget to support my page

spx500 buy setuphello good people this is my institutional tactics setup
1:6 Risk reward ratio
if you like my ideas follow hit the like button comment and show some love ❤️
wish you good luck and good trading
help me get funded

SP500. Weekly trading levels 27 - 31.05.2024During the week you can trade from these price levels. Finding the entry point into a transaction and its support is up to you, depending on your trading style and the development of the situation. Zones show preferred price ranges WHERE to look for an entry point into a trade.
If you expect any medium-term price movements, then most likely they will start from one of the zones.
Levels are valid for a week, the date is in the title. Next week I will adjust the levels based on new data and publish a new post.
! Please note that brokers have a difference in quotes, take this into account when trading.
The history of level development can be seen in my previous posts. They cannot be edited or deleted. Everything is fair. :)
----------------------------------------------
I don’t play guess the direction (that’s why there are no directional arrows), but zones (levels) are used for trading. We wait for the zone to approach, watch the reaction, and enter the trade.
Levels are drawn based on volumes and data from the CME. They are used as areas of interest for trading. Traded as classic support/resistance levels. We see the reaction to the rebound, we trade the rebound. We see a breakout and continue to trade on a rollback to the level. The worst option is if we revolve around the zone in a flat.
Do not reverse the market at every level; if there is a trend movement, consider it as an opportunity to continue the movement. Until the price has drawn a reversal pattern.
Don't forget to like Rocket and Subscribe!!! Feedback is very important to me!

Is Now the Right Time to Invest in the S&P 500?Last week, the S&P 500 index, which comprises the 500 largest U.S. companies by market capitalization, reached a new all-time high, hitting $5,341.88 during intraday trading on Thursday, May 23.
Warren Buffett has long recommended an S&P 500 index fund as the ideal investment for those who don't have the time to analyze individual stocks in depth. The recent milestone seems to support his advice. However, with the stock market at a new peak, enthusiasm for AI potentially becoming excessive, and both interest rates and inflation remaining persistently high, is now truly the best time to invest in the S&P 500?
For those wary of the markets, there are numerous reasons to hesitate before buying into stock market averages. The S&P 500, a market-cap weighted index, is heavily influenced by large technology companies that have seen substantial gains recently, buoyed by a bull market that began in October 2022. Several factors have propelled these tech giants to new heights: interest rates seem to have peaked, inflation has dropped from its high of 9.1% in June 2022 to just 3.4% last month, and the surge in artificial intelligence has provided significant momentum.
It's not just Nvidia (NVDA 6.79%) reaching new peaks, with a staggering market cap of $2.6 trillion and a high P/E ratio of 62. Many cloud giants and related semiconductor stocks have also soared, driven by strong growth expectations. But will this growth persist indefinitely? AI investments must ultimately prove their worth to companies and consumers. Currently, companies are spending unprecedented amounts on AI chips and data centers to avoid falling behind. This situation is reminiscent of the dot-com boom in the late 1990s, which led to an epic crash in 2000. The tech-heavy Nasdaq Composite dropped 76.8% from peak to trough, while the S&P 500 fell by 49.1%.
Could the AI bubble burst similarly? AI momentum seems unstoppable, but few predicted the 2000 crash, believing internet hypergrowth would continue indefinitely. A slowdown in growth from an AI company could trigger a significant correction. While this might not happen soon, it’s a possibility.
Additionally, inflation impacts the Federal Reserve's decisions on interest rates, which in turn affect stock valuations and the economy. If inflation remains "sticky" and exceeds expectations, the Fed might keep interest rates higher for longer to meet its 2% target. This scenario poses a risk, as the S&P 500 is currently trading at a historically high valuation of 27.6 times trailing earnings, compared to the historical average of 16.1. If interest rates and inflation surge again, it could be a precarious time to invest in this frothy market.
On the flip side, renowned investor Peter Lynch famously noted, "there is always something to worry about" in the markets. Although the historical average P/E ratio of the S&P 500 is significantly lower than today's, the market has generally traded at a higher P/E ratio in recent years, averaging around 22.5 over the past decade. While this is still below current levels, it is much closer. Additionally, avoiding the stock market over the past ten years due to fears of high valuations would have resulted in missing out on 236% gains, including dividends.
Moreover, the average annual return of the S&P 500 from 1928 through 2023, since the Standard & Poor's index was first developed, is approximately 9.9% with dividends reinvested. Since the index expanded to 500 companies in 1957, the long-term annualized return has been an even better 10.3%. Certainly, there have been critical moments right before significant market crashes when investing would have seemed unwise. However, Ben Carlson, author of the blog A Wealth of Common Sense, highlights in his study that with a long enough time horizon, even investments made at market peaks before major crashes have yielded positive long-term results. Carlson examined hypothetical investments made just before eight of the market's worst crashes, from September 1929 to October 2007, prior to the Great Recession.
Five years later, three of those investments still produced positive results. Ten years out, six of the eight investments were profitable, with three delivering triple-digit gains. Twenty years after investing at these worst possible times, all eight were profitable, with all but the September 1929 investment yielding multi-hundred-percent gains. Prudent investing, however, is not solely about one-time, large investments. By consistently saving a portion of income and dollar-cost averaging into an index fund monthly, it's inevitable to invest before some market peaks but also benefit from subsequent downturns.
Market crashes are notoriously difficult, if not impossible, to predict. History shows that even investments made before the worst market peaks and crashes tend to recover over time, as the earnings of American businesses grow. Conversely, attempting to time the market can be costly, as demonstrated by those who have stayed out of the market for the past decade.
Therefore, the S&P 500 still seems like a wise buy today, even at its elevated valuation, provided there is a consistent investment plan with regular monthly, quarterly, or annual allocations.

SP500 Short trading opportunity(swing-trading) 1I expect a swing of about 70 points+- all the way down to 5200
The USA Federal Reserve has indicated that it won't be cutting interest rates anytime soon, I think this was a bit unexpected and not entirely priced in before so we should see some decline of the value of the SP500 Index.
However I can assume only short term, don't know the longer term implications of this that is why I am only aiming for a small downtrend at the very least.
Stop Loss 5295+- (or 5305+-), take profit is 5200+-.
I am risking $27500+- dollars in a Short Position, I will lose $100+- if it hits the stop loss and make around $465 if it hits my take profit.

S&P 500 Analysis: Good News is Bad NewsS&P 500 Analysis: Good News is Bad News
Yesterday, S&P Global reported its Purchasing Managers' Index (PMI) values for the US, which exceeded expectations. According to ForexFactory:
→ Manufacturing PMI: actual = 50.9; expected = 50.0; previous = 50.0.
→ Services PMI: actual = 54.8 (the highest value since May 2023); expected = 51.2; previous = 51.3.
However, the high PMI values, indicating a healthy economy, led to a drop in the stock index. The S&P 500 index (US SPX 500 mini on FXOpen) fell by more than 1.5% following the publication.
What explains this case of "good news is bad news"?
The point is, amid high business activity, manufacturers reported rising prices for a range of resources, suggesting that goods inflation might strengthen in the coming months. Stock market participants might have interpreted this as a reason for the Federal Reserve to maintain high rates for a longer period – hence the sharp decline in the index.
"Companies remain cautious with respect to the economic outlook amid uncertainty over the future path of inflation and interest rates, and continue to cite worries over geopolitical instabilities and the presidential election," said Chris Williamson, Chief Business Economist at S&P Global Market Intelligence, in an interview with Reuters.
Technical analysis of the S&P 500 chart today (US SPX 500 mini on FXOpen) shows that:
→ the price has been forming an ascending channel since 19 April (shown in blue);
→ bulls failed to hold above the March high around the 5285 level (a bearish sign);
→ the psychological level of 5300, which showed signs of support this week, has now been breached and may act as resistance. Conversely, the 5200 level, after being breached, has shifted its role from resistance to support (as indicated by arrows).
So far, the bearish momentum that emerged yesterday following the PMI news release is being contained at the median line of the blue channel. But if sentiment does not change today, the median might be breached, and then the path to the lower boundary of the channel will open for the S&P 500 price (US SPX 500 mini on FXOpen).
Trade global index CFDs with zero commission and tight spreads. Open your FXOpen account now or learn more about trading index CFDs with FXOpen.
This article represents the opinion of the Companies operating under the FXOpen brand only. It is not to be construed as an offer, solicitation, or recommendation with respect to products and services provided by the Companies operating under the FXOpen brand, nor is it to be considered financial advice.

Myth Busting: Market Style!I have been very lacking in producing educational content. I know a lot of you follow for my analysis, some others for my indicators and some others for my educational content. While I have been getting back in the groove of posting for the later 2, I have neglected those interested in educational content.
So voila, here we are with an educational post! In this post, I want to dispel and or validate some market conjecture based on actual research and my own observations, from indicators, to chart patterns to different market theories. The post will be formatted in the great MYTH BUSTER format!
Hope you enjoy!
Myth #1: All indicators are interchangeable and one indicator can be used for any type of equity.
You all likely have seen, whether on tradingview or other sites, the magical indicators that “work in all markets!”. And you tell yourself, “oh wow, too good to be true, right?!” And the fact is, it is too good to be true. This is a myth and is absolutely false. No one indicator will be cross compatible for multiple different equity types. No one indicator will be sufficient even within the same equity types (i.e. just because RSI works for MSFT doesn’t mean it will work for NVDA).
You can actually objectively view this for yourself if you apply my ATREE indicator . Just as a quick explanation, the ATREE indicator uses MFI, Stochastics, RSI and Z-Score to determine sentiment. It will also provide you with back-test results as to how effective it is at gauging sentiment based on these individuals technical. If we look at ATREE for NVDA:
Pay attention to the backtest results on the right side of the screen. These provide the raw success rate of its sentiment estimations. For NVDA, we can see that Stochastics can predict sentiment roughly 76% of the time on the daily timeframe. However, if we flip on over to MSFT
We see that Z-Score is actually much more effective at determining sentiment than RSI, Stochastics or MFI. This is just an example, but to show you another one, let’s take the Ichimoku cloud with buy and sell signals and put it on MSFT:
We can see, it nailed the buy but pretty hit or miss for the sell. I wouldn’t say this is a great indicator to use for MSFT shorting. However, if we flip on over to SPY with the same indicator:
Its been a bit more on point.
Understanding unique individual ticker intricacies is my whole shebang. I produce models to predict sentiment. If you are part of my community you know there are 4 commonly used models that we employ, from LSTM, to ARIMA, to Eucledian Distance models to Momentum Technical Models. Not all are equal for all stocks. For example, we will reference momentum for tickers like NVDA, but Eucledian distance is better for tickers like SPY. How do you figure this out? Backtesting! I’ve said it in other educational ideas and I saw it again, you always need to backtest your strategy!
Myth #1 Verdict:
So, are all indicators good for all markets?
NO! This is BUSTED!
Myth #2: Trendlines and chart patterns are helpful and pivotal for trading stocks
There tends to two schools of thought to this. Train 1 is that trendlines are pivotal for trading and making assumptions. Train 2 of thought is that they are not helpful and quite frankly useless. However, in mainstream trading theory and teachings, trendlines are a often cited and often taught method of market determination. But are they useful?
Well, it depends. Trendlines can give us context, without trendlines we would have no context and would just be trading random candles on a blank space. The degree of efficacy of these trendlines can depend on things like:
a) The duration of the trend,
b) The skill of the chartist,
c) The number of tests of the trendline,
d) The overall economic climate that a stock is in.
Obviously, I personally found trendlines problematic, hence my resorting to computer modelling. However, in my years of experience and my maturity in the market, I reapproached the trendline theory as supplemental to modelling and have made some relevant observations, which I will discuss below.
The first point is that not all tickers are created equal. Sound familiar? Yeah this was the basis of Myth #1 about technical indicators. The truth is, it applies to trendlines, too. Let’s take a look at DUO, a small cap stock:
DUO recently did, arguably, a dead cat bounce and produced this pennant you see in the chart above. Now DUO is small cap, low volume stock that barely moves. Suddenly, we have this pennant out of nowhere and with no major catalyst. So what happened?
Nothing, it ended up selling into EOD multiple times.
Let’s take a look at NVDA:
NVDA broke down from a major trendline around April 3rd. This would signal a short. And indeed, it was a short, for a short duration of time. It mostly was rangy and stagnant. But it did sell. This trendline was from January of 2024 and ended in April of 2024, a relatively long and stable trendline. NVDA is also a large cap stock with huge amounts of liquidity and volume, So we can expect follow through on major trendlines.
Trendlines have also been pivotal for intra-day trading. Let’s look back at NVDA (since its my daily go to for day trading):
During open, on the 1 minute chart, we could see NVDA forming a pennant. Based on the modelled data we had two potential price targets, a bull target of 957 and a bear target of 929. What NVDA does with this pennant (breakout or breakdown) can help us ascertain which target price is correct.
What happened?
NVDA broke down, and then it travelled all the way down to that 929 target:
So it would seem that chart patterns are indeed useful. However, they are not overly helpful with indicating target price, As well, they are only useful when the stock has high volume, good liquidity and is heavily traded. The efficacy of trendlines and chart patterns likely comes from volume of traders who are looking at similar trendlines. In order for trendlines to influence a stock movement, you need volume from traders who are paying attention to the same thing in order to move it. This is why penny stocks and low float, small cap stocks do not respect trendlines and patterns in the same way.
Verdict for Myth #2?
CONFIRMED!
Myth #3: Market theories such as Elliot Wave Theory (EWT) and Efficient Market Theory are applicable to all tickers and the market as a whole?
If you are a trader, likely you subscribe to one market theory or another. If you are investor, its likely you subscribe to modern portfolio management theory (which emphasizes diversification). If you are a day or swing trader, perhaps you subscribe to the Efficient Market Hypothesis or EWT.
These all remain “theories” because they have yet to prove valid or invalid in research. However, aside from the investor mindset of diversification, no one theory of the market works for all tickers. In fact, some research has come out about EWT specifically and has indicated that it can be useful in predicting some markets (such as the S&P); however, the results are not generalizable to others (specifically Crypto and some individual tickers).
The same can be said about the efficient market theory/hypothesis and many others that have been researched, disproven in some circumstances and proven in others.
So, what is the verdict here?
This is BUSTED. Market theories, aside from an investor mindsight, are not generalizable to all equities, instruments and markets. This is semi based on my own observations but mostly from academic research I have reviewed on this topic (hence why I have no beautiful charts to display for this myth).
And the last myth I will cover in this post:
Myth #4: Diversification is pivotal for day traders
The wisdom here is that, you need to diversify for day trading. You need to identify setups on whatever stock has those setups and play whichever stock confirms best to your setup. The truth is, this is rarely necessary. In fact, sticking to a handful of routine stocks can be advantageous, as you will grow to learn the intricacies of the particular stocks you are trading routinely.
I go through phases but right now, 99% of the time I am trading NVDA. This works for me because there is usually always a setup available on large cap stocks. Let’s review some of the setups I have taken on NVDA:
You can see NVDA loves its morning triangles, and I love them too!
You can absolutely get back with trading one ticker, provided that it has good volatility and movement. In times of economic stability (i.e. currently), its best to avoid the indices as a day trading candidate as they tend to move slower and more purposefully.
So what is the verdict of Myth #4?
Thanks for reading everyone!
I may do more of these myth buster posts, they’re fun to research and find examples and really reflect on what I have learned as a trader. Feel free to submit any myths you live by in the comments and I can look into them for maybe a future post!
Safe trades as always!

S&P 500 Daily Chart Analysis For Week of May 31, 2024Technical Analysis and Outlook:
In the shortened trading week, the S&P 500 hit our expected resistance level of 5323 and promptly fell as part of the renewed upward movement toward the support level of 5257 and the nearby support level of 5221. A solid upward bounce is on its way to target our newly identified key resistance level of 5323 for the upcoming trading week.

SPX; 5k to reach for wave iv) and v) of (5) to 5550?DISCLAIMER : All labelling and wave counts done by me by manually and i will keep change according to the LIVE MARKET PRICE ACTION. So don't bias, hope on my trade plans...try to learn and make your own strategy...Following is not that much easy...I AM NOT RESPONSIBLE FOR ANY LOSSES IF U TOOK THE TRADE ACCORDING TO MY TRADE PLANS....THANKS LOT..CHEERS
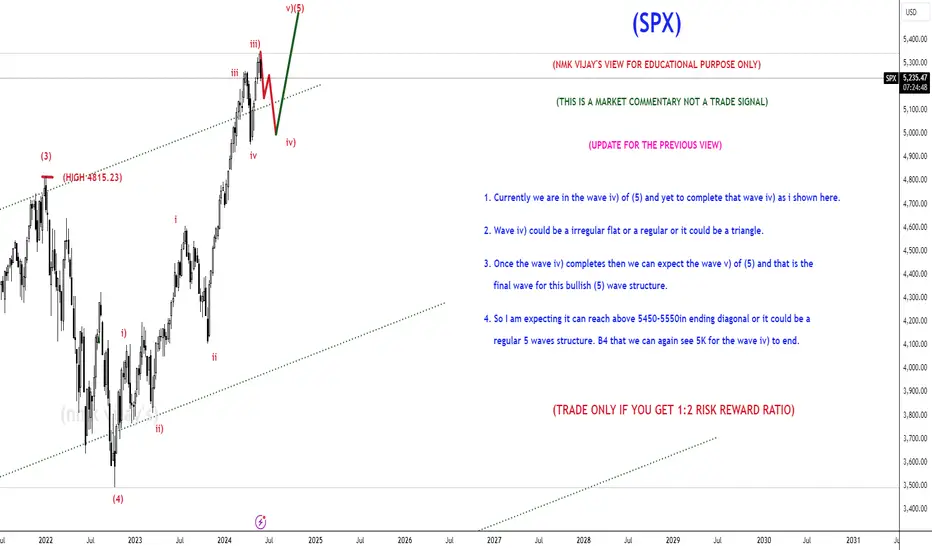
Down trendSPX going downwards looks week to me any opions? Looks like there was also a huge 5 minute red volume spike yesterday durign trading open, that seems suspicious to me no? but its gotta bounce the market is great! infaltions going down!
