000001 trade ideas


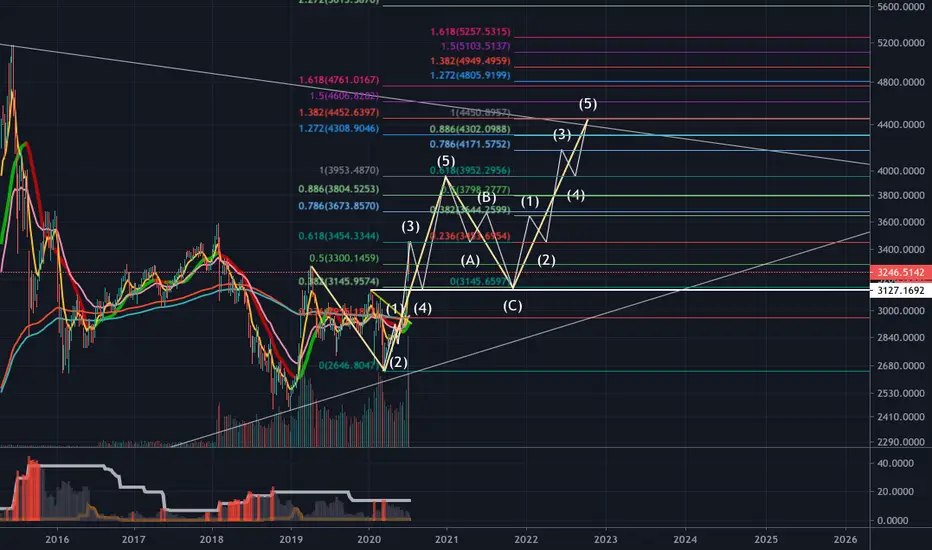
SSE longNow we could see clear ABC pattern with A=2C(red lines), if the Kline up breaks B. We can see a clear bull trend with target:
11000-17000 , even higher

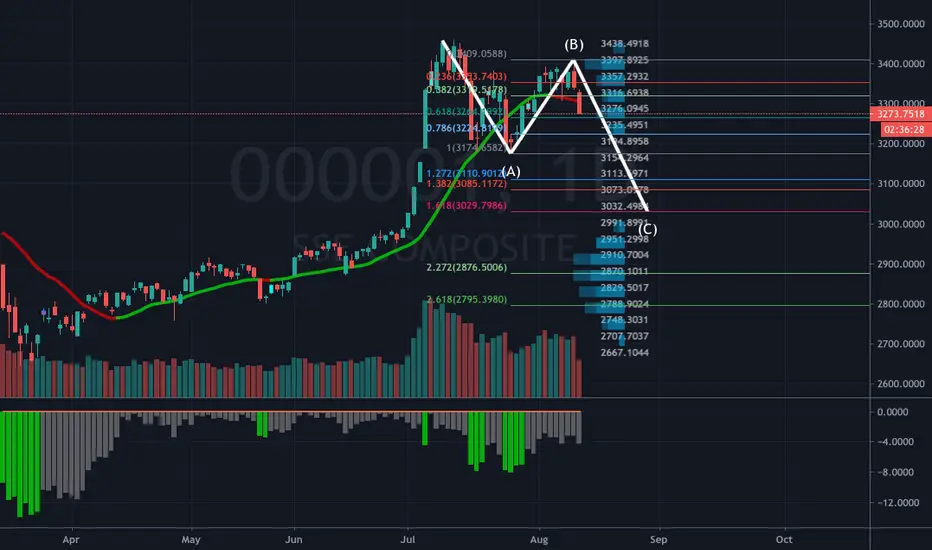
SSE Elliot Wave Prediction3-rd wave now and it will dump to 3127 to be the 4th wave then comes to the 5th wave.

Time for a Breather… A Look at the SSEThe rally of late has driven prices on the Shanghai Composite (SSE) to a 52 week high, smashing through key resistance levels along the way. Much of this sudden interest in Chinese stocks is all thanks to the Chinese Government egging on Chinese Investors to jump on the bandwagon and throw their money at the stock market. Needless to say, this led to a huge spike in volume, and stock prices followed through.
Historically huge volume spikes have led to weak returns for the short and long term, for the medium term stocks returns were above average. Perhaps It’s time for a breather here at (1) as the SSE tests 38.2 fib level along with dual trend line resistance. Immediate daily support is at 3288.91. Above resistance at (1) Investors should look for a re-test of January 2018 highs which came in at 3591.70.


Chinese government can manipulate US elections by manipulating There is a positive correlation between the US and Chinese stock markets, and the Chinese government can manipulate US elections by manipulating the Chinese stock market.
The Chinese government is using its power to raise the Chinese stock index.The Chinese government has boosted the US stock market by pulling up the Chinese stock market.
Through such abductions, it is difficult for Trump to adopt a tough trade policy against China.The probability of Trump's re-election appears to be in the hands of the Chinese government.


000001As the epidemic is brought under control, the economy restarts, and ultra-loose monetary and active fiscal policies have laid the foundation for the stock market.


SSE will go up againwave 3 has finished i and ii.
now time to go up again and form III~V steps.
the target is the twice*gap =3028+(3028-2767)=3289 , at least.

Long China (SSE composite)A weekly AB=CD, a 0.618 support and a daily pin bar is found
A very good chance to guess the bottom.


Shanghai Stock Exchange (SSE) On Decision Level
SSE has reached a key pivot point.
a conjunction of a major falling trendline and horizontal structure constitute a decision level for the market.
taking into consideration current fundamental sentiment, the market will most likely go south!
our confirmation will be a bearish breakout of a rising trendline!
incase of a bearish breakout the market will reach 2750 & 2500 levels!
good luck!
please, support the idea with like and comment! thank you!

bounce back to 2945 and 2893, then DIVEa bit bearish, but I believe we haven't really understood the impact of the coronavirus yet

SSE COMPOSITE: Drop After Gap Close
hey traders,
on Shanghai Stock Exchange the market has recently dropped with a gap.
now it recovers and most-likely the gap will be closed.
what is important here is the fact that the last candle close before the gap gives a strong resistance for the market.
so even in case of a 100% recovery, the market can drop just after the gap will be filled.
good luck!

