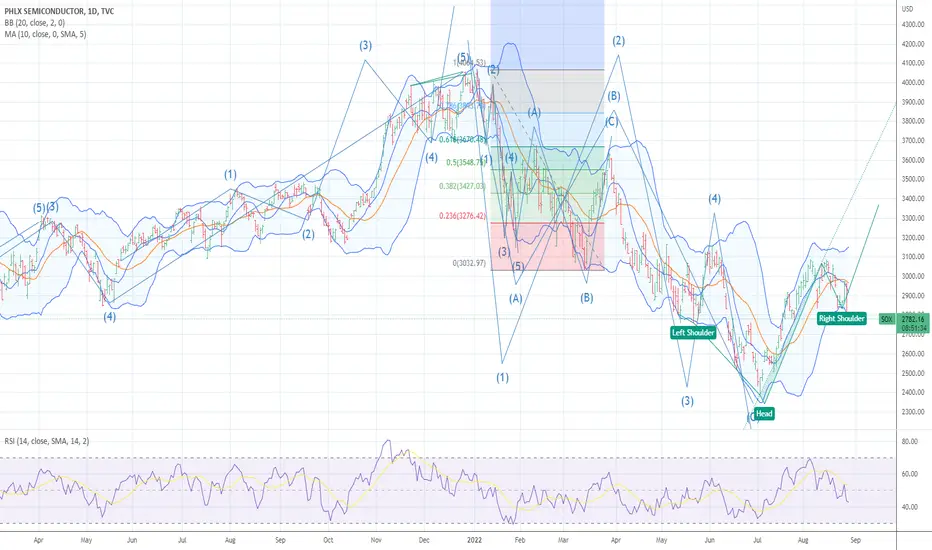
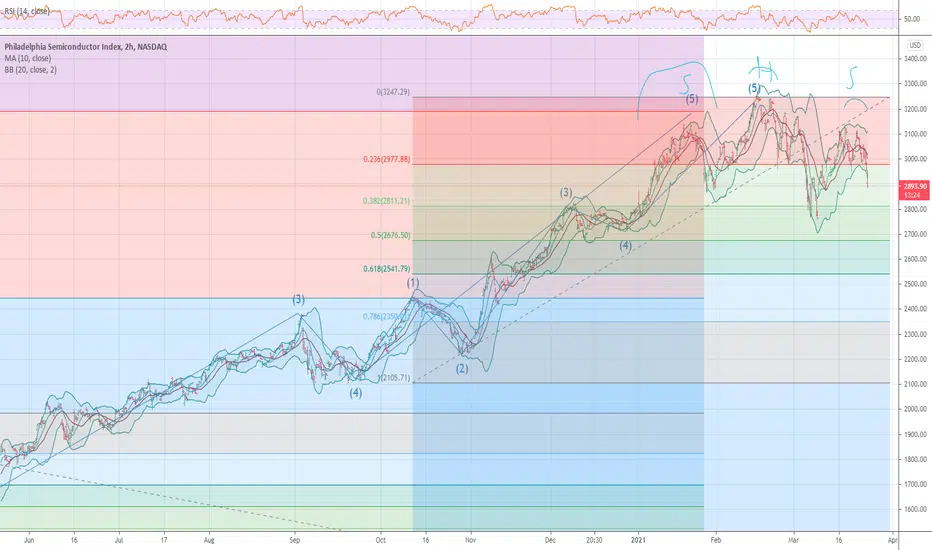
SOX INDEX BOTTOMED MOVE TO 75% PLUS NET LONG MARKET We now have an invented head n shoulder bottom and a wave 4 pullback look for a rally DO NOT BE SHORT ANYTHING
SOX trade ideas
Are Semiconductors Stalling?The Philadelphia Semiconductor Index ripped about 29 percent between early July and early August, but now it may be showing signs of fatigue.
The first pattern on this chart is last Thursday’s peak of 3087 -- slightly below the early June high of 3159. That lower high is potentially noteworthy when compared with the broader Nasdaq-100, which pushed above the respective level on its chart to the highest since early May. It could be sign of relative weakness for chips.
Next is Monday’s doji candlestick, a potential reversal pattern. Also notice how SOX appears to have broken a rising trendline.
Third, the Relative Strength Index has retreated from near an overbought condition.
Finally, you have an increasingly mediocre news flow . Nvidia’s warning yesterday, combined with similar news from Intel and Western Digital , may reflect less-than-stellar fundamentals in chip stocks.
Given the market’s healthy bounce and falling volatility, SOX may not retest the 2022 lows. But it may have lost its mojo and chop around for a while as investors seek outperformance in other corners of the market.
TradeStation has, for decades, advanced the trading industry, providing access to stocks, options, futures and cryptocurrencies. See our Overview for more.
Important Information
TradeStation Securities, Inc., TradeStation Crypto, Inc., and TradeStation Technologies, Inc. are each wholly owned subsidiaries of TradeStation Group, Inc., all operating, and providing products and services, under the TradeStation brand and trademark. You Can Trade, Inc. is also a wholly owned subsidiary of TradeStation Group, Inc., operating under its own brand and trademarks. TradeStation Crypto, Inc. offers to self-directed investors and traders cryptocurrency brokerage services. It is neither licensed with the SEC or the CFTC nor is it a Member of NFA. When applying for, or purchasing, accounts, subscriptions, products, and services, it is important that you know which company you will be dealing with. Please click here for further important information explaining what this means.
This content is for informational and educational purposes only. This is not a recommendation regarding any investment or investment strategy. Any opinions expressed herein are those of the author and do not represent the views or opinions of TradeStation or any of its affiliates.
Investing involves risks. Past performance, whether actual or indicated by historical tests of strategies, is no guarantee of future performance or success. There is a possibility that you may sustain a loss equal to or greater than your entire investment regardless of which asset class you trade (equities, options, futures, or digital assets); therefore, you should not invest or risk money that you cannot afford to lose. Before trading any asset class, first read the relevant risk disclosure statements on the Important Documents page, found here: www.tradestation.com .

Recession is just starting and the Sox bubble comes to an endWell recession started since Q1 and yes, Q2 will be ugly too
Considering lowering of bitcoin.
Considering lowering of Nvidia+AMD stocks earnings
Considering lowering of TSMC, ASML earnings
+ end on market multiple
Then Sox have to sink deeply to 550.
The lowest value in 2009 is 168 so it's still 3 times higher than the lowest point and rich will remain rich. But latest buyer will suffer
Thanks for checking my other insight and have nice trade


$SOX Looking at a long term Bear$SOX has long been the growth engine of the $SPY. It has now entered a bear phase, being well below the 12 month SMA on the monthly chart, which now serves as resistance. We may be witnessing a paradigm shift in the market, where commodities, precious metals, and staples lead the market and the old growth stocks, lag. I hold no hope out for semiconductors at the moment.

LOOK for the EXIT NOW All indexes have now rallied back to drop the put/call and to peak in the time cycle peak march 25thn I maintain we are going to drop very hard into april 7/10
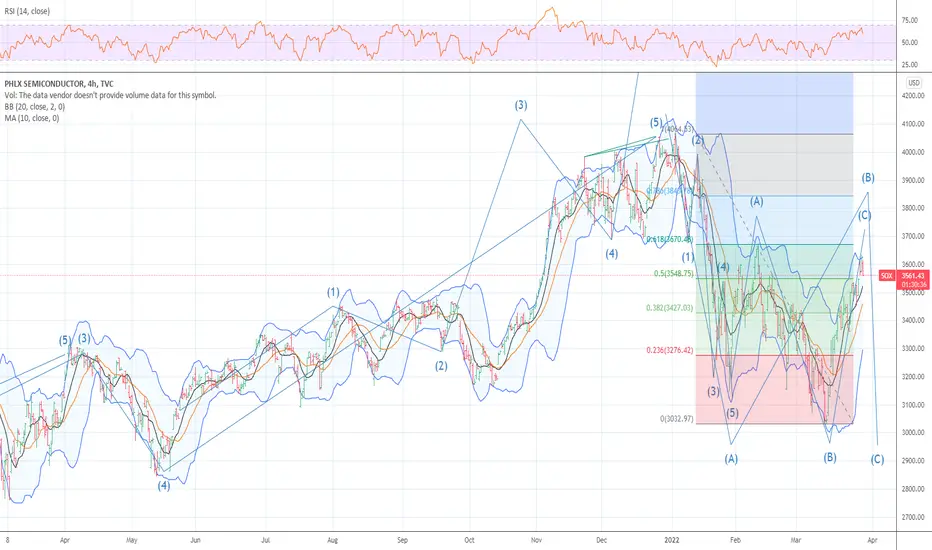
$SOX will continue to trend lower toward a target of 2975SOX continues to set lower lows. Two scenarios, one (green zig zag) is a reversal into cloud resistance to 3544. This would be a 78% extension from low point C. The other scenario (red zig zag) would be a 1.78% extension from point B. The RSI is in a solid downtrend, and the point & figure chart on the daily has a target of 3001. If I were waging bets, I would go with the 2975 target. The trend is your friend, until it ain't.

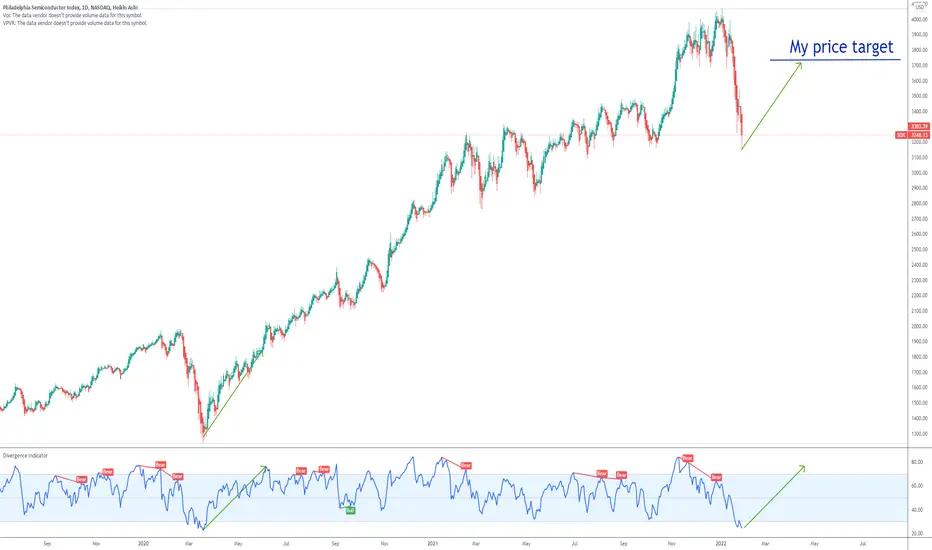
SOX PHLX Semiconductor Shortage won`t be solved anytime soon !!Secretary of Commerce Gina Raimondo:
“The semiconductor situation is going to take a long time to fix”
“This is one I feel confident saying it's not going to be fixed in a month or two, or six, or 12 months.”
For now PHLX Semiconductor (^SOX) is oversold and we can see in the chart what was the price movement after the last oversold area.
I expect to be the same now, since the semiconductor shortage won`t be solved anytime soon.
My price target is 3730.
Looking forward to read your opinion about it.
$SOX close to long running gap fillI have been waiting for a long while for SOX to fill that gap at 3592.76. Closed today at 3612 on the daily, and gap fill would put it at the bottom of Ichy cloud support, and just below 50% fib. Note the Gartey extension D at 1.38 right on the gap fill line. Should get a bounce from point D, and remember, SOX most always leads SPY....

5 WAVES UP ENDED LOOK FOR A CRASH We have ended into a Month in history with the highest level of major market tops outside of late aug 17 to sept 10 thru out the markets history . at THIS POINT and the wave structure as well as fib relationships within the the wave structure . I can now say we are setup for a CRASH cycle I think it has started and will see it over the next few days . the weekly rsi has not confirmed this rally as well as the nysi and nymo models put/call/ are not at any bottom or value nor is the naz dsi or fear greed index . BEST OF TRADES WAVETIMER
SOX, this market barometerAs I keep saying, the SOX is truly considered as the market barometer. And today, pre-US market open we have a clear engulfing candle that is also breaking the the Kijun Sen. Do we also have a double top? Of course, the candle still needs to close but nevertheless, it worth pointing it out for today's session.
Trade Safe, Trade Smart!
Glossary :
TS = Tenkan Sen | KS = Kijun Sen | LS = Lagging Span/Chikou Span
DLY = Daily | WLY = Weekly | MLY = Monthly
TL = Trend Line | TP = Take Profit | SL/INV = Stop Loss / Invalidation | TF = Timeframe
** THIS ANALYSIS IS MY OWN OPINION AND IS NOT A TRADING OR INVESTME NT ADVICE. ALWAYS TRADE WITH CARE **

SOX The SOX is often considered as a strong leading indicator, so monitoring its evolution is always a good thing to do.
For the moment, the SOX is slowly but steadily retracing, the first level of support on the DLY chart is the TS at around 3846. Breaking that level may push the price to the KS. If the KS break, than we will have a clear short/medium term bearish signal.
Glossary :
TS = Tenkan Sen | KS = Kijun Sen | LS = Lagging Span/Chikou Span
DLY = Daily | WLY = Weekly | MLY = Monthly
TL = Trend Line | TP = Take Profit | SL/INV = Stop Loss / Invalidation | TF = Timeframe
** THIS ANALYSIS IS MY OWN OPINION AND IS NOT A TRADING OR INVESTME NT ADVICE. ALWAYS TRADE WITH CARE **

Buy chip makersI think they are on sale, Chips may be ATH again.
Fundamentals are actually good thanks to data centers.
DDR5 is coming, it will cause some short-term pain for the DD4 but DD5 will be in shortage soon.

Warnings Signs in the Chips?Semiconductors have been a key pillar of the S&P 500’s advance since 2016, and now they may be flashing a warning signal for the overall market.
This chart of the Philadelphia Semiconductor Index shows how gains have been slowing all year. Prices have squeezed into an increasingly narrow range, with the 50-day simple moving average (SMA) recently dipping within about 1 percent of the 100-day SMA.
Also notice the action as SOX tried to climb above 3300. After some initial closes at new highs, the candlesticks turned solid as early rallies got sold.
Next, looking at the weekly chart, MACD has steadily waned since February (bearish divergence). There was also a bearish outside week July 12-16, which SOX has yet to return above:
Finally, the chart below shows the ratio of SOX vs the SPDR Technology ETF (XLK). Notice how it’s been slipping since April – despite what should be a lot of good news involving strong demand for chips. This may suggest that, should another summer pullback occur, SOX may be especially vulnerable.
TradeStation is a pioneer in the trading industry, providing access to stocks, options, futures and cryptocurrencies. See our Overview for more.


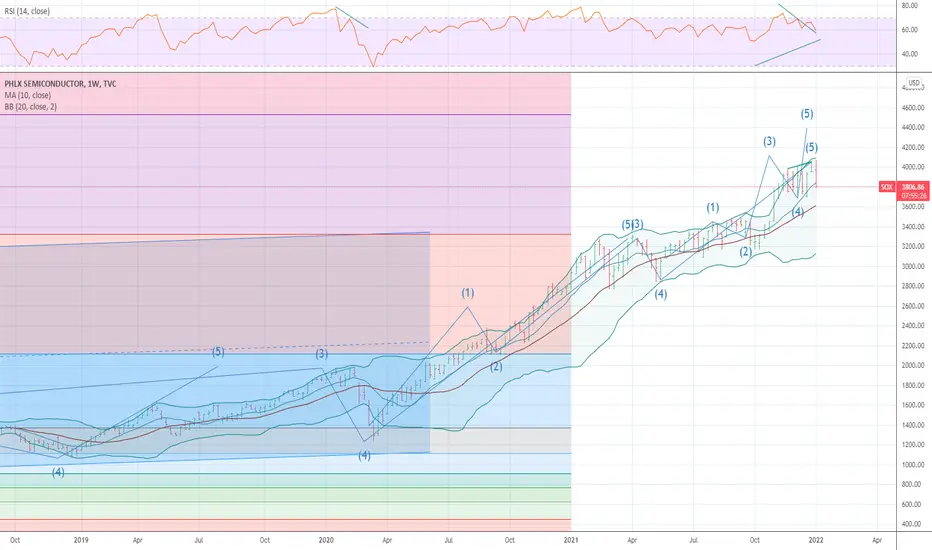
A last upmove til 2022 in semiconductors is possibleAfter the rally in semiconductors we should see a cool down of the rally, but with sustainable higher stock prices till 2022.
Then the correction in this sector should be take place.
So holding semiconductors or buying dips are possible this year.

The Bears Tried to Sink Chipmakers, and FailedChip stocks have lagged along with the broader technology sector. But just when you think they’re dead, they have a session like yesterday.
Notice how the Philadelphia Semiconductor Index opened 2.2 percent below its close the previous session. Also notice how quickly it bounced and ended the session up a full 2 percent.
The low was lower than Tuesday’s and the high was higher: a textbook bullish engulfing candle.
In isolation, that’s interesting for the bulls. But there’s more because the weekly chart is trying to form a bullish inside candle with a higher low and a lower high. Following a drop like we’ve seen in the last month, that can signal a steadying in price before a change in direction:
Next, stochastics have shown an oversold condition all month (on the daily chart). It’s gradually lifting.
Finally consider the descending trendline that began on April 27. This creates the potential for a bullish breakout if the current range holds.
TradeStation is a pioneer in the trading industry, providing access to stocks, options, futures and cryptocurrencies. See our Overview for more.

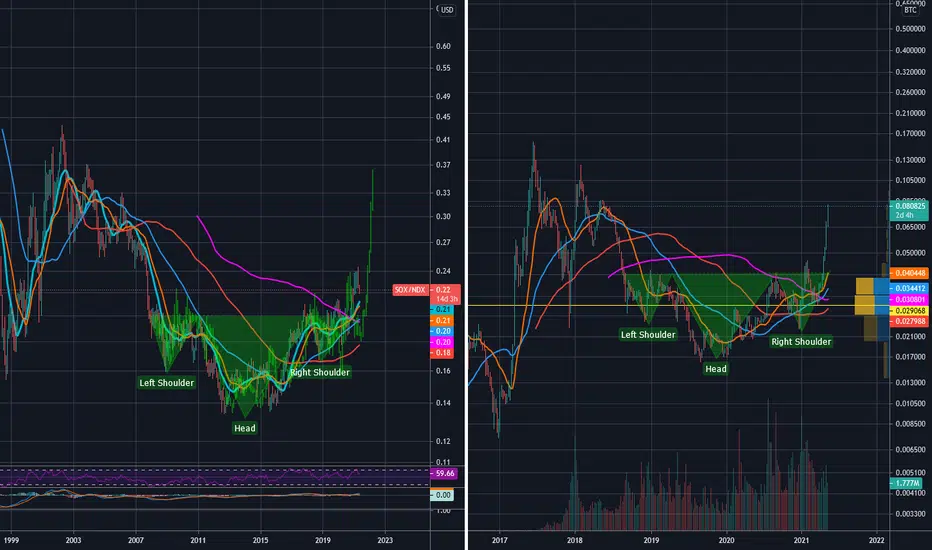
is $SOX to $NDX the $ETH to $BTC?Interesting comparison in performance of SOX to NDX and ETH to BTC. both have formed an inverse head and shoulders patterns, eth/btc has broken out while SOX/NDX seem to be following the same pattern but just have not broken out yet.
Don’t Forget About the ChipsThe Nasdaq is trying to stabilize, which could draw buyers back to semiconductors.
Chip stocks like NXP Semiconductors, Broadcom and Lam Research were some of the biggest gainers in the Nasdaq-100 last week. That helped push NDX ahead of the S&P 500 for the first time in five weeks. The relative strength also came amid two positive weeks for the Philadelphia Semiconductor Index.
The SOX chart above shows our Smart Relative Strength script with a 10-day interval.
This chart highlights underperformance in the broader SPDR Technology ETF in the same period:
This is noteworthy for two reasons. First, almost every chip company reported strong numbers last earnings season. Second, semiconductors are highly cyclical. Unlike high-multiple software stocks, they stand to benefit from the economy reopening. That’s especially important at a time when investors are unloading expensive growth stocks like Zoom Video Communications (ZM).
In addition to rebounding more quickly than other big tech names, SOX is now battling a downward-sloping trend line that began in mid-February. Traders may look for a breakout if the broader Nasdaq stabilizes or bounces in coming sessions.
TradeStation is a pioneer in the trading industry, providing access to stocks, options, futures and cryptocurrencies. See our Overview for more.


tick TICK TICK BOOM CHIP sector now setup start to move into a net short position cycles are bearish into feb 9 to march 10 on most everything
