Global Market Analysis: Dynamics of the World Economy1. The Structure of the Global Market
The global market isn’t a single entity but rather a network of interconnected sub-markets—each influencing the other. These include:
Equity Markets: Stock exchanges across the world like NYSE (USA), LSE (UK), NSE (India), and Nikkei (Japan) where investors buy and sell company shares.
Bond Markets: Governments and corporations issue bonds to raise capital, influencing global interest rates and credit flows.
Foreign Exchange (Forex) Markets: The largest financial market globally, with a daily turnover exceeding $7 trillion, dictating exchange rates between currencies.
Commodity Markets: Covering energy (oil, gas), metals (gold, copper), and agricultural products (wheat, soybeans), these markets affect inflation and industrial costs.
Derivatives Markets: Financial instruments like futures, options, and swaps that allow investors to hedge risks or speculate on price movements.
These markets operate through both developed economies (like the U.S., Japan, and the EU) and emerging economies (like China, India, and Brazil), whose increasing influence has reshaped global trade and investment flows.
2. Key Drivers of the Global Market
Global markets respond to a mix of economic, political, and technological factors. The main drivers include:
a) Economic Indicators
Economic health is reflected through metrics such as:
GDP Growth Rates: Indicate whether economies are expanding or contracting.
Inflation & Interest Rates: Affect consumer spending, borrowing, and corporate investment.
Employment Data: High employment boosts consumption; unemployment signals economic stress.
Trade Balances: Show the difference between exports and imports, influencing currency strength.
b) Monetary Policy
Central banks like the U.S. Federal Reserve, European Central Bank, and Reserve Bank of India regulate liquidity and interest rates. A dovish stance (low interest rates) usually stimulates growth and stock markets, while a hawkish stance (high rates) can slow them down.
c) Geopolitical Stability
Wars, trade conflicts, and political shifts (like Brexit or U.S.-China tensions) can disrupt supply chains, affect oil prices, and create investor uncertainty.
d) Technological Innovation
Technology drives productivity, reshapes industries, and spawns new sectors such as AI, renewable energy, and digital finance, which attract global capital.
e) Investor Sentiment
Perception often drives short-term market movements. When optimism prevails, “risk-on” assets like equities rise; when fear sets in, “safe-haven” assets like gold and the U.S. dollar gain.
3. Regional Market Analysis
Global market dynamics differ across regions, each contributing uniquely to the world economy.
a) The United States
The U.S. remains the largest and most influential economy, contributing about 25% to global GDP. Its stock markets (Dow Jones, S&P 500, NASDAQ) serve as global benchmarks.
Key trends include:
Strong consumer-driven growth.
Leadership in technology and innovation.
Monetary policy shifts under the Federal Reserve.
Fiscal deficits and debt ceiling debates impacting investor confidence.
b) Europe
Europe’s markets are heavily influenced by the European Central Bank (ECB) and political cohesion within the European Union (EU).
Key challenges include:
Energy dependence post-Russia-Ukraine conflict.
Slower growth in aging economies.
Regulatory leadership in green and digital finance.
c) Asia-Pacific
Asia is the growth engine of the global economy, led by:
China: Transitioning from export-led to consumption-driven growth.
India: A rising powerhouse in technology, services, and manufacturing.
Japan and South Korea: Advanced in technology and industrial exports.
ASEAN nations (like Indonesia, Vietnam, and Malaysia) are also gaining traction as supply chain alternatives to China.
d) Middle East and Africa
The Middle East, dominated by oil exporters like Saudi Arabia and UAE, is diversifying through Vision 2030-type reforms.
Africa, meanwhile, is emerging with vast natural resources and young demographics, attracting long-term infrastructure investments.
e) Latin America
Countries like Brazil, Mexico, and Chile are resource-rich economies sensitive to commodity cycles. Political instability and inflation remain challenges, but trade relations with the U.S. and China support recovery.
4. Interconnectedness and Globalization
Global markets are deeply interconnected, meaning a policy decision in one country can ripple across the world.
Examples include:
U.S. interest rate hikes affecting capital outflows from emerging markets.
China’s slowdown reducing demand for global commodities.
European energy crises impacting industrial production worldwide.
This interdependence has both benefits (growth opportunities) and risks (contagion effects). The 2008 global financial crisis and the 2020 pandemic illustrated how quickly economic shocks can spread globally.
5. Role of Currencies and Forex Markets
Currency markets are the lifeblood of global trade. Exchange rates determine export competitiveness and investment returns.
Key currency dynamics include:
U.S. Dollar Dominance: The dollar remains the global reserve currency, used in 80% of trade settlements.
Euro and Yen Influence: Widely used in international trade and finance.
Emerging Market Currencies: Often volatile, influenced by capital flows and inflation.
Digital Currencies & CBDCs: Central Bank Digital Currencies (CBDCs) are reshaping how cross-border payments occur.
Currency volatility affects companies’ profits, inflation, and global investment flows, making forex analysis central to global market forecasting.
6. Commodity Market Overview
Commodities form the foundation of industrial and consumer economies.
Key categories include:
a) Energy
Crude oil and natural gas dominate global energy trade. Prices fluctuate with OPEC+ decisions, geopolitical tensions, and renewable energy transitions.
b) Metals
Gold, silver, copper, and lithium are vital for industries, technology, and investments. The global shift toward electric vehicles (EVs) has increased demand for lithium and copper.
c) Agriculture
Food commodities like wheat, corn, and soybeans are influenced by weather, trade policies, and geopolitical disruptions.
Commodities often act as inflation hedges and safe-haven assets during market uncertainty.
7. Emerging Market Trends
a) Digital Transformation
E-commerce, fintech, and digital payments have redefined trade and consumption. Platforms like Amazon, Alibaba, and Paytm are reshaping economies.
b) Renewable Energy Transition
As climate concerns rise, investment is shifting from fossil fuels to green technologies, including solar, wind, and hydrogen energy.
c) AI and Automation
Artificial intelligence is boosting efficiency, data analysis, and algorithmic trading, impacting labor markets and productivity.
d) Supply Chain Diversification
Post-pandemic disruptions and geopolitical risks have encouraged “China+1” strategies, moving manufacturing to countries like India and Vietnam.
e) Financial Inclusion
Microfinance, mobile banking, and digital currencies are bringing millions into the formal economy in developing nations.
8. Risks and Challenges in the Global Market
a) Inflation and Interest Rate Volatility
High inflation erodes purchasing power, prompting central banks to raise interest rates — often slowing growth and raising recession fears.
b) Geopolitical Tensions
Conflicts in Ukraine, Middle East tensions, and U.S.-China rivalry continue to threaten global stability.
c) Climate Change
Extreme weather impacts agriculture, infrastructure, and migration patterns, introducing long-term risks.
d) Debt Crisis
Several nations face rising public debt burdens due to post-pandemic stimulus measures and global borrowing costs.
e) Cybersecurity Threats
As financial systems digitize, cyberattacks pose serious risks to global financial stability.
9. Tools and Techniques for Global Market Analysis
Professionals use multiple analytical frameworks to understand market movements:
Fundamental Analysis: Examines economic data, earnings reports, and macro indicators.
Technical Analysis: Studies price patterns, volume, and momentum indicators for trading insights.
Sentiment Analysis: Gauges investor mood using surveys, volatility indexes (VIX), and media trends.
Quantitative Models: Use algorithms and big data for predictive insights.
Comparative Analysis: Compares economies or sectors to identify relative strengths and weaknesses.
Data sources include IMF, World Bank, OECD, and Bloomberg, which provide real-time global financial information.
10. The Future of Global Markets
The coming decade promises profound transformation in how global markets operate:
a) Multipolar World Order
Power is shifting from the West to Asia, especially China and India, creating new centers of influence.
b) Rise of Green Finance
Investments in renewable energy, ESG (Environmental, Social, Governance) funds, and carbon trading are gaining momentum.
c) Digital Currencies and Blockchain
Blockchain-based systems may reduce transaction costs, enhance transparency, and change global banking.
d) Artificial Intelligence in Trading
AI-driven trading and predictive analytics are enhancing efficiency but also increasing systemic risks from algorithmic errors.
e) Inclusive Globalization
Future markets will focus on inclusive growth, ensuring developing economies benefit equitably from global trade.
Conclusion
Global market analysis is more than tracking numbers—it’s about understanding the story of interdependence, where economic, political, and social forces intersect. The 21st-century global market is a complex web that connects the fate of nations and individuals alike.
From the movement of oil prices to central bank policies, from AI-driven innovation to geopolitical realignments, every element plays a role in shaping global outcomes.
For investors, policymakers, and businesses, mastering global market analysis means recognizing patterns, anticipating shifts, and adapting strategies in an ever-evolving environment.
As we move toward 2030 and beyond, the future global market will be defined by sustainability, technology, and cooperation—where knowledge, agility, and foresight become the true currencies of success.
Trade ideas
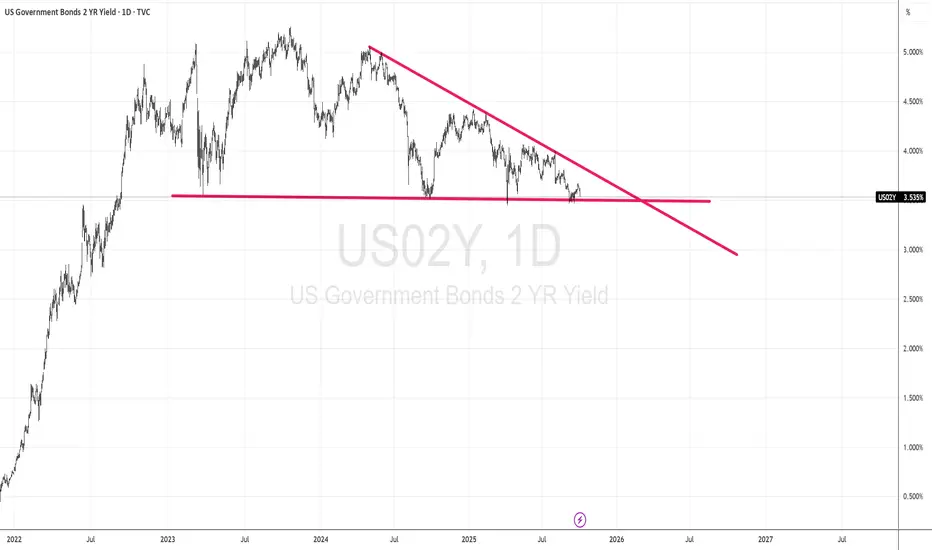
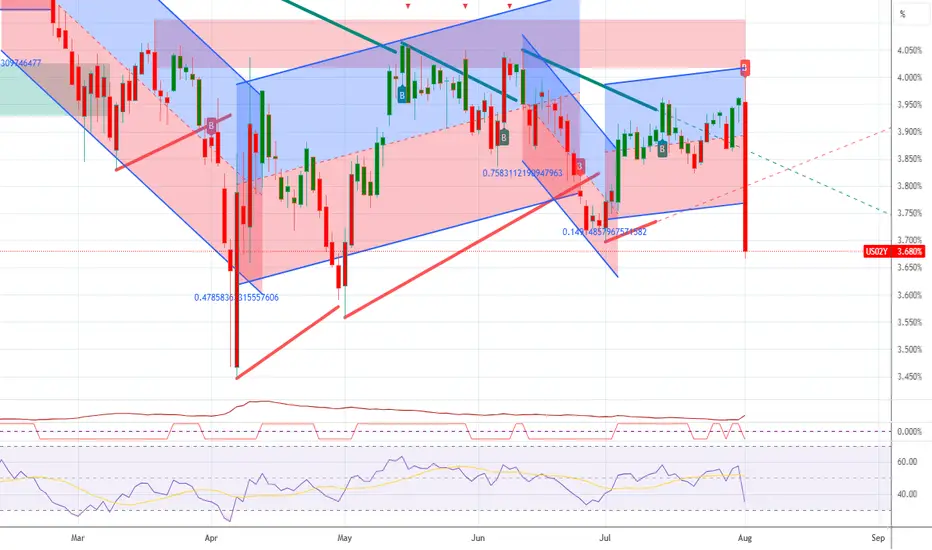
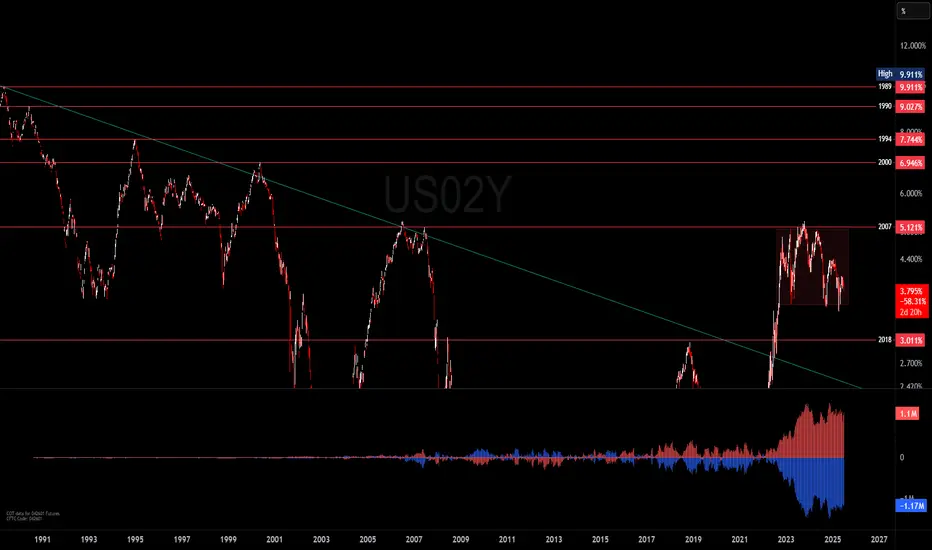
Interest rates US02Y to go downBoth H&S patterns developed in the market and the descending triangle.
To me, it looks like a double confirmation
Economic Tipping Point...GFC 2.0? In this video we discuss;
Bond Market Signal using the 2 year yield.
Is the 2 year yield giving us a 2007 / 2008 signal?
We look at the correlation of the 2 year yield vs SPX
We analyze the forward expectation of interest rate projections.
Observe and dissect last weeks economic employment data.
There will be plenty of opportunities in this next phase of the market cycle.
I will be looking very forward to the plethora of trade alerts I will be issuing.

Credit crunch about to explodeI strongly believe we are about to experience a recession in the coming months. Open some spy shorts posisitions for late 2026.
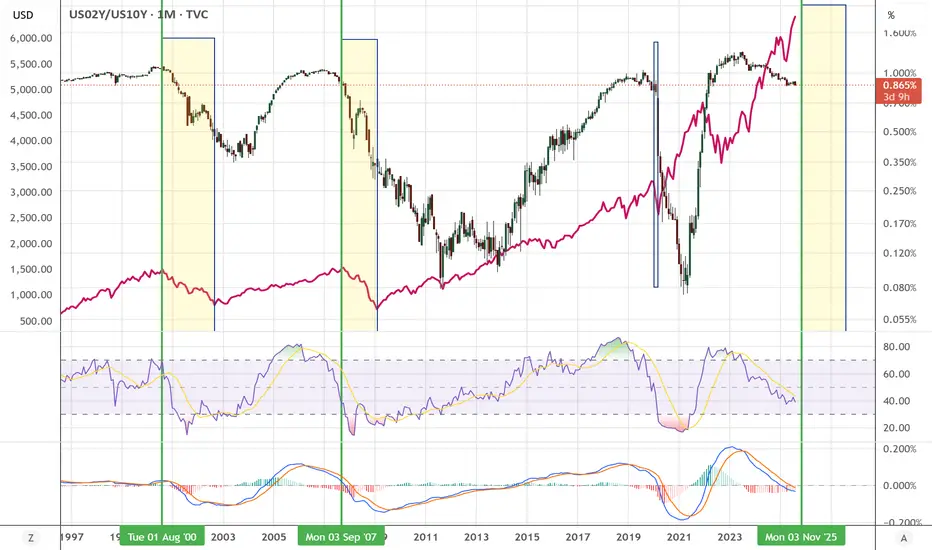
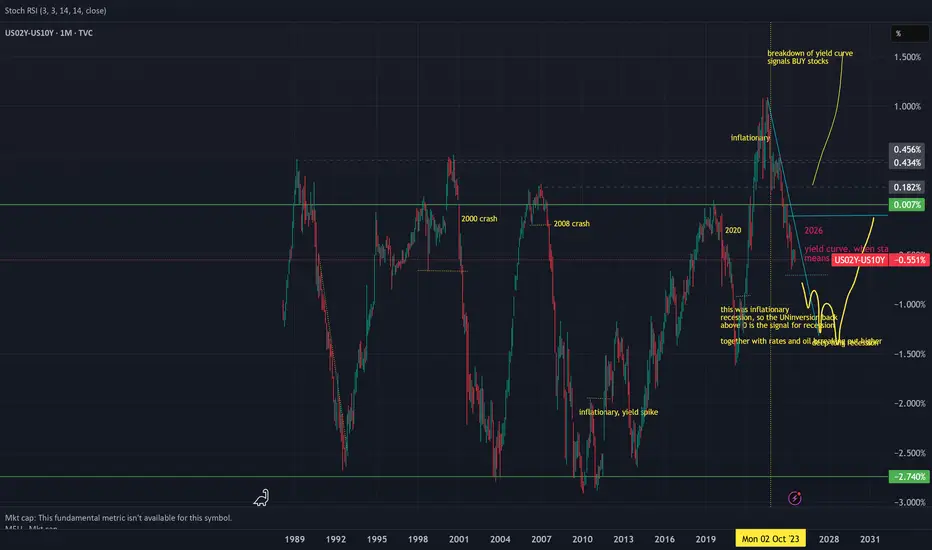
US02Y / US10Y - Look at history! Crash incoming?Look at 2000-2002 and 2007-2009.
What happened when the US02Y / US10Y went down?
MEGA CRASH!
Do you really think history will not repeat itself this time?
The question is, how long do we have?
Nov 2025 might be the top?
Could we go up until early 2026?
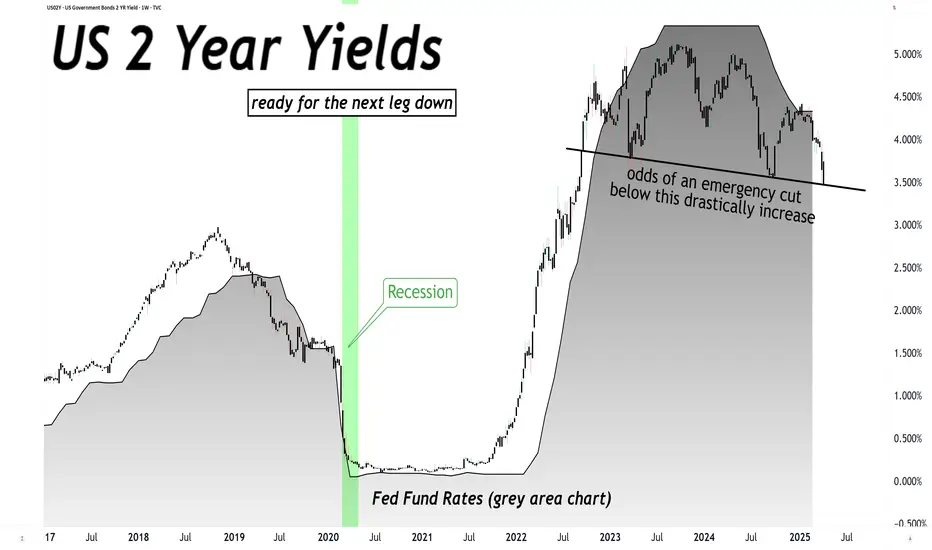
LMACD of the US02Y has just dipped bellow 0!In the past while rates have been elevated for a period of time things have gone bad for risk markets once the LMACD dipped bellow 0. Could be this time different?
US02Y LongUS02Y Long on the regression break.
I am considering the other bond markets as this has already moved a long way.
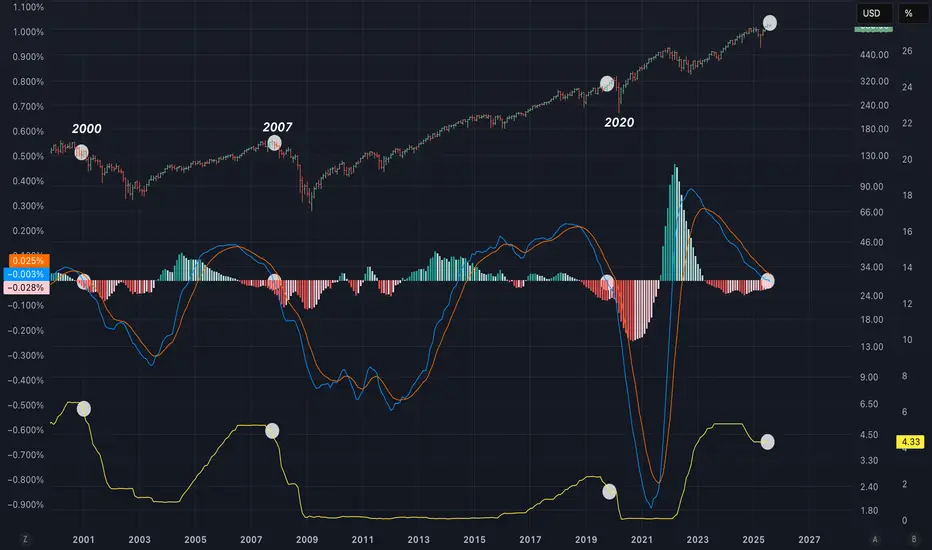
Yield Spreads Warning About the Secular Bull MarketAre we in the final innings of the current secular bull market that emerged from the robust injection of liquidity in response to the 2008 Financial Crisis? Yield spreads are giving us a warning and one that should not be dismissed. Yield spreads show (shorter to longer in lighter blue to darker blue) a spread that has been shrinking, for quite some time. The yield curve has been inverted for a while too. As we tread these dangerous waters, one has to wonder, when and where will the next event to cause a credit contraction come from? Is it a bubble? Can it be AI, Credit, geopolitics, currency based? Something will distress the credit markets and, as long as the yield spread remains shrunken, this event will almost certainly cause a recession. TVC:US02Y PYTH:US10Y TVC:US30Y SP:SPX

yield curve signalling recession when it turns down except 2025 in 2025 this broke as stocks roar while yield curve is crashing down
US02Y Bond ShortUS02Y bond is now net short on the regression break.
I am considering taking this trade.
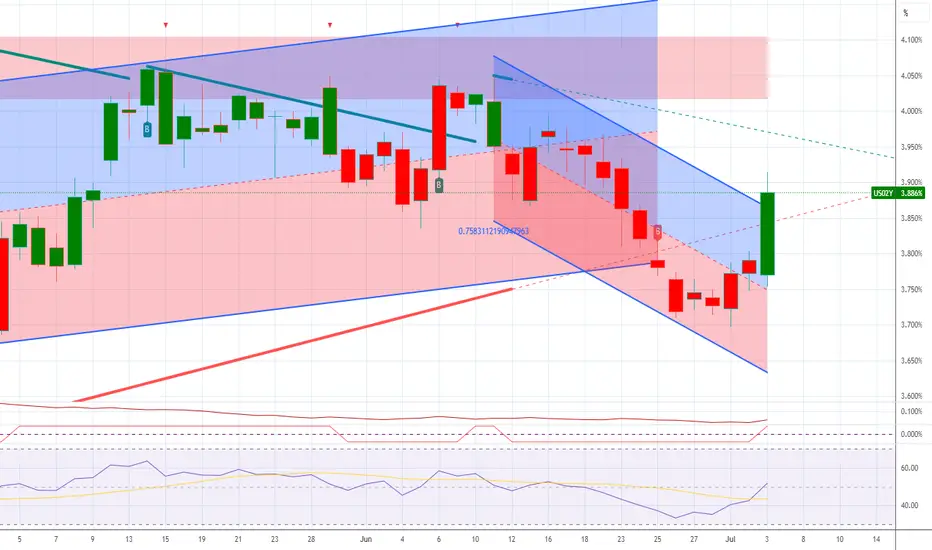
US02Y Bond LongUS02Y is now net long on the regression break.
There appears to be a increase in hedging as the stock market push to new highs.

looks like a distributionThis is logaritmic chart from US2Y, commercials offloading their positions or the other part is closing their positions???
This is how I see the odds split for a recession.This is how I see the odds split for a recession.
Above the black line, recession less likely.
Below the red line, recession more likely.
The Fed fund rate tracks this over time.

A crash in the horizonAs I have been suspecting for a long time. Markets are getting closer to a crash. On the weekly the 2 years bond market confirmed the change in the trend to the downside. Once we dip bellow the blue ema we might be entering in a doomed phase. Cheers

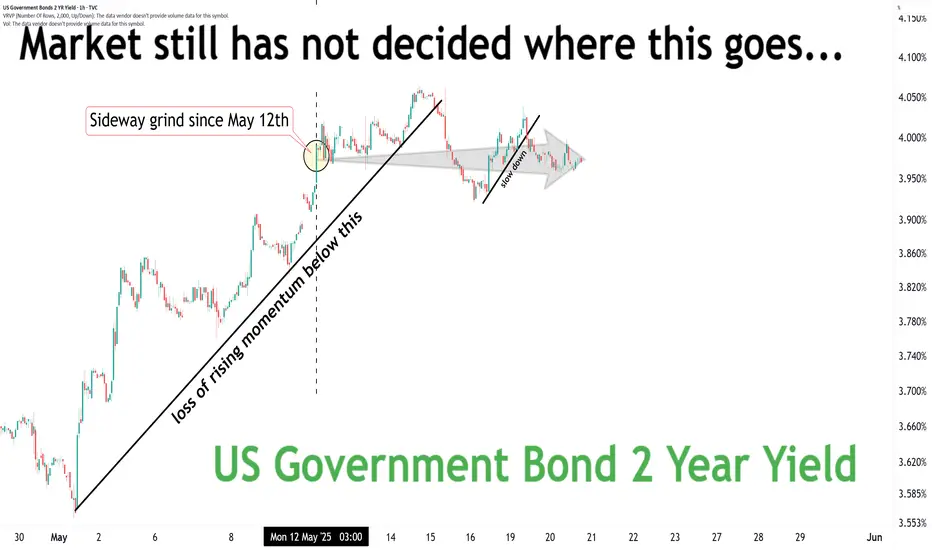
Short Term YieldsA very short term outlook on the short end of the yield curve...
This is a KEY chart to understand where the risks reside (recession or not).
Where do you think this goes next?
RecessionsWatch what the aggregate of market participants are doing.
Above black= recession risk is lower
Below red = recession risk is higher
So no... the economy is not out of the woods yet.

Stock markets STILL not out of the woods.Stock markets STILL not out of the woods.
The setup is there for an EPIC fail.
But WHEN?

2-Year US Treasury Yield: The Market's Immediate Sentiment GaugeThe 2-year Yield currently trades at 3.805%, unfolding within a well-defined three-year falling wedge pattern. This formation follows an extraordinary surge from 0.105% in January 2021 to 5.283% in October 2023—reflecting rapid Fed rate hikes and inflation expectations. The 4.00% level, which aligns with the Fibonacci 23.6% retracement, has been tested multiple times, indicating it as the immediate battlefield for bulls and bears.
Warning Signs: If yields fail to stay above 4.00%, a decline toward 3.54% and 3.25% becomes probable, with further downside risk to 2.80%, 2.62%, 2.34%, and potentially 2.16%. A drop this deep would imply markets are aggressively pricing in future rate cuts or recession fears.
Breakout Scenario: A decisive break above 4.00% would violate the falling wedge ceiling, targeting 4.17% and 4.46% and possibly retesting the 5.00% highs. This would indicate renewed fears of sticky inflation or delayed Fed easing.
Fundamental Reflection: The 2-Year is the cleanest read on front-end Fed policy sentiment. Its sensitivity to Fed language, inflation trends, and geopolitical disruption (e.g., tariffs) means its technical posture is deeply rooted in macroeconomic fragility.

US02YThe differential between the US02Y (2-year U.S. Treasury yield) and EUR02Y (2-year Eurozone government bond yield) significantly influences the trade directional bias for the USD and EUR this month. Here's how:
Impact of Yield Differential on Currency Trade
Interest Rate Differentials: A widening yield spread between US02Y and EUR02Y, where U.S. yields rise more than Eurozone yields, typically supports the U.S. dollar (USD) against the euro (EUR). This is because higher yields in the U.S. attract more capital, increasing demand for the USD and causing it to appreciate relative to the EUR. Conversely, if Eurozone yields rise faster, the euro may strengthen against the dollar.
Monetary Policy Expectations: The yield differential also reflects expectations about future monetary policy actions by the Federal Reserve (Fed) and the European Central Bank (ECB). If the yield spread widens in favor of the U.S., it may indicate expectations of more aggressive rate hikes by the Fed compared to the ECB, supporting the USD. If the spread narrows or reverses, it could signal a more dovish Fed stance or a more hawkish ECB stance, potentially weakening the USD.
Risk Sentiment and Economic Outlook: Rising yields in either region can signal improving economic conditions and confidence, attracting investment and supporting the respective currency. However, if yields rise due to inflation concerns or economic uncertainty, the impact on currency strength can be more complex.
Trade Directional Bias This Month
USD Bias: If the US02Y yield remains higher than the EUR02Y yield, Long positions in the USD, expecting it to strengthen against the EUR due to higher returns and potentially more aggressive Fed rate hikes.
EUR Bias: Conversely, if the EUR02Y yield rises faster than the US02Y yield, long positions in the EUR, anticipating euro strength due to higher returns and possibly more hawkish ECB policy.
Key Factors to Watch
Monetary Policy Announcements: Any statements from the Fed or ECB about future rate decisions can significantly impact yield differentials and currency movements.
Economic Indicators: Data on inflation, GDP growth, and employment can influence yield spreads and currency trade.
Market Sentiment: Shifts in investor risk appetite and confidence in economic growth can also affect currency direction.
In summary, the yield differential between US02Y and EUR02Y is a crucial indicator for determining trade directional bias in the USD/EUR pair. A wider spread favoring the U.S. generally supports the USD, while a narrowing or reversal supports the EUR.

US02YAs of April 2025, China holds approximately $759 billion to $761 billion in U.S. Treasury securities, making it the second-largest foreign holder of U.S. debt after Japan. This is a significant reduction from its peak holdings of $1.316 trillion in November 2013.
Potential Effects if China Sells Its U.S. Treasury Holdings
If China decides to sell off its U.S. Treasury holdings, the potential effects could be substantial:
Spike in U.S. Interest Rates: A mass sell-off would flood the market with U.S. Treasuries, depressing their prices and causing yields (interest rates) to rise sharply. Higher borrowing costs for the U.S. government could exacerbate fiscal challenges.
Weakened U.S. Dollar: Selling large amounts of Treasuries would likely weaken the dollar as demand for dollar-denominated assets declines. This could lead to inflationary pressures within the U.S..
Global Financial Shock: The sudden liquidation of such a large asset pool could destabilize global financial markets, given the interconnectedness of economies and reliance on U.S. Treasuries as a safe-haven asset.
Economic Impact on China: Dumping Treasuries would also hurt China by reducing the value of its remaining holdings and potentially destabilizing its own economy due to reduced export competitiveness and financial ripple effects.
Likelihood of a Sell-Off
Despite these risks, such a move is considered unlikely for several reasons:
Mutual Economic Dependency: The U.S.-China economic relationship is deeply intertwined, with China relying on U.S. debt as a safe investment for its foreign exchange reserves and the U.S. benefiting from China's purchase of Treasuries to fund its deficit.
Self-Inflicted Damage: A sell-off would harm China’s own financial stability and trade relations, making it a risky strategy even during heightened tensions.
In conclusion, while the threat of China weaponizing its Treasury holdings exists, it remains a double-edged sword that would inflict significant damage on both economies and global markets

IT IS GETTING UGLY OUT THERE.IT IS GETTING UGLY OUT THERE.
Expect the Fed to cut rates real soon.
Then cut them again.
And again.
The weekly US02Y downtrend has started. As I have been expecting months ago, now the downtrend is been printed on the guppy emas. The trend is changing to red like in the past. This indicates that maybe a big correction might follow the SP500 in the coming months.

US2Y - BUY (SELL BOND) strategy 3 hourly chart - regression The 2Y US yield has move lower and broken important yield level of 3.9650 area. The GAP lower 3.8500 currently, is providing an extremely oversold reading and other time frames are oversold as well but not as severe.
Strategy SELL BONDS @ 3.78-3.8350 yield and take profit with a 15 basis points toughly benefit. It does also support some US$ strength in coming sessions, is my personal view.
