USDCAD I Weekly CLS I Model 1I Target 3M CLS LowHey, Market Warriors, here is another outlook on this instrument
If you’ve been following me, you already know every setup you see is built around a CLS Footprint, a Key Level, Liquidity and a specific execution model.
If you haven't followed me yet, start now.
My trading system is completely
About U.S. Dollar / Canadian Dollar
The US Dollar vs. the Canadian Dollar is a very popular currency pair due to the extremely large amount of cross border trading that occurs between the U.S. and Canada. The CAD is considered to be a commodity currency because of the large amount of natural resources, especially oil, that are mined and exported to southern neighbors. The USDCAD is one of the most traded currency pairs in the world.
Related currencies

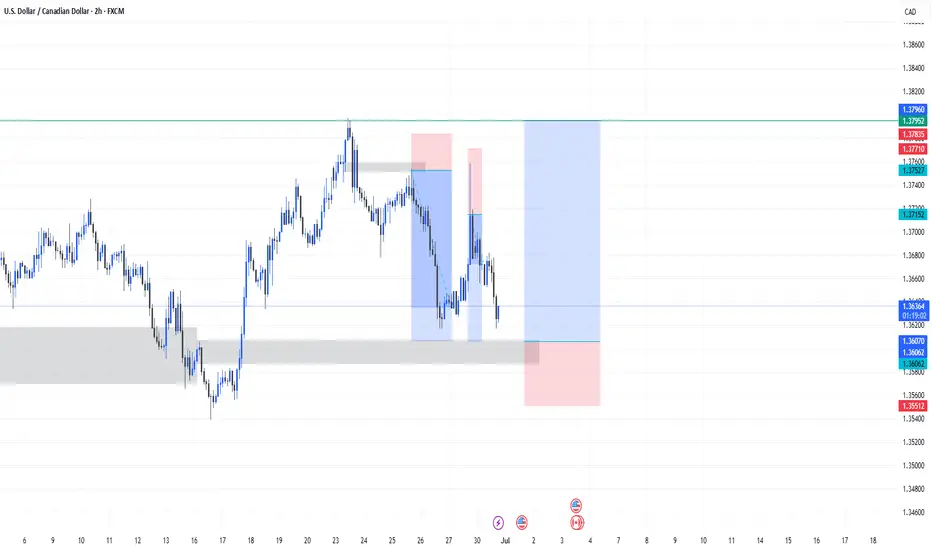
USDCAD Bearish Reversal Trade Setup – 3H Chart Analysis (June 26 Entry Zone: 1.37279 – 1.37554
🔹 Stop Loss: 1.37934
🔹 Target: 1.35278
🔹 Risk-to-Reward (RR): ~1:2.5
🧠 Technical Breakdown
Trend Overview:
Overall trend shows a downtrend from earlier June, followed by a corrective bullish move.
Price failed to sustain above the 200 EMA (blue line), indicating cont

USDCAD: Oil Price Weakness Weighs on CAD – Can USD Capitalize?USDCAD: Oil Price Weakness Weighs on CAD – Can USD Capitalize?
Hello TradingView community!
Today, let's analyze the USDCAD pair, which is showing interesting dynamics as the CAD faces pressure from falling oil prices.
🌍 Macro Drivers: CAD Struggles Amidst Lower Oil, USD Upside Limited
The USDCAD

USDCAD: Very Bearish PatternThe USDCAD has created a head and shoulders pattern at a significant intraday horizontal resistance.
A bearish breakout from this neckline indicates strong selling pressure, suggesting that the pair is likely to continue declining, potentially reaching at least the 1.3600 level.

USDCAD: Price Approaching Buying Zone, Will DXY Bounce Back? The USDCAD pair has dropped significantly in recent times, particularly as the DXY index has plummeted. The extremely bearish nature of the DXY suggests that the price of USDCAD is melting. Both fundamental and technical indicators indicate a potential bullish price reversal for this pair, which cou

USDCAD long trade setup for this week📈 USDCAD Long Setup Idea – Weekly Play 💯
Here’s a clean bullish setup on USDCAD (2H timeframe) I’m eyeing for this week:
🔹 Key Zones:
- Demand Zone: Strong reaction from the 1.35500–1.36000 area, with price respecting this grey support block multiple times.
- Supply Flip: Previous structure zone
Weekly Forecast Based on Simplified Wave Analysis for USD/CADThe downward wave that formed on the USD/CAD chart tis year has been followed by a corrective move since late May. The pair is largely confined to a sideways price channel. The current wave structure remains incomplete, lacking final segment.
Forecast:
The pair may decline further in the coming da
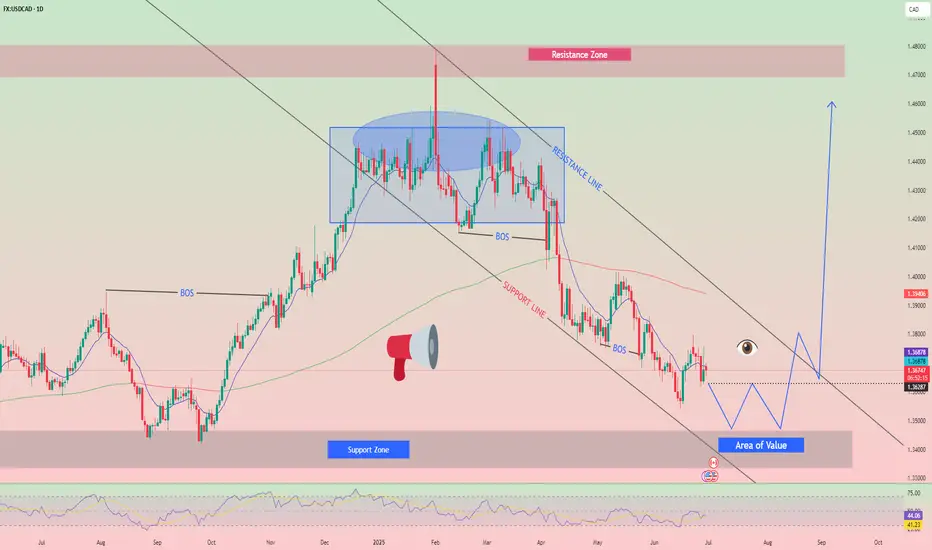
USDCAD 4-hour chart
USDCAD is consistently trading within a clearly defined descending price channel, indicating a prevailing downtrend.
Price action is characterized by a series of lower highs and lower lows, respecting both the upper and lower boundaries of this channel.
The pair has recently encountered resist


USDCAD Strongest long-term Sell in the market right now.At the beginning of the year (January 15, see chart below), we made an unpopular bearish call at the time, hinting that the USDCAD pair was approaching its Resistance Zone, hence a multi-year Top was in order:
As you can see, the moment the price hit that Resistance Zone, it got instantly rejec

See all ideas
Summarizing what the indicators are suggesting.
Oscillators
Neutral
SellBuy
Strong sellStrong buy
Strong sellSellNeutralBuyStrong buy
Oscillators
Neutral
SellBuy
Strong sellStrong buy
Strong sellSellNeutralBuyStrong buy
Summary
Neutral
SellBuy
Strong sellStrong buy
Strong sellSellNeutralBuyStrong buy
Summary
Neutral
SellBuy
Strong sellStrong buy
Strong sellSellNeutralBuyStrong buy
Summary
Neutral
SellBuy
Strong sellStrong buy
Strong sellSellNeutralBuyStrong buy
Moving Averages
Neutral
SellBuy
Strong sellStrong buy
Strong sellSellNeutralBuyStrong buy
Moving Averages
Neutral
SellBuy
Strong sellStrong buy
Strong sellSellNeutralBuyStrong buy
Displays a symbol's price movements over previous years to identify recurring trends.
Frequently Asked Questions
The current rate of USDCAD is 1.36467 CAD — it has increased by 0.24% in the past 24 hours. See more of USDCAD rate dynamics on the detailed chart.
The value of the USDCAD pair is quoted as 1 USD per x CAD. For example, if the pair is trading at 1.50, it means it takes 1.5 CAD to buy 1 USD.
The term volatility describes the risk related to the changes in an asset's value. USDCAD has the volatility rating of 0.04%. Track all currencies' changes with our live Forex Heatmap and prepare for markets volatility.
The USDCAD showed a −0.69% fall over the past week, the month change is a −1.21% fall, and over the last year it has decreased by −0.67%. Track live rate changes on the USDCAD chart.
Learn how you can make money on rate changes in numerous trading ideas created by our community.
Learn how you can make money on rate changes in numerous trading ideas created by our community.
USDCAD is a major currency pair, i.e. a popular currency paired with USD.
Currencies are usually traded through forex brokers — choose the one that suits your needs and go ahead. You can trade USDCAD right from TradingView charts — just log in to you broker account. Check out the list of our integrated brokers and find the best one for your needs and strategy.
When deciding to buy or sell currency one should keep in mind many factors including current geopolitical situation, interest rates, and other. But before plunging into a deep research, you can start with USDCAD technical analysis. The technical rating for the pair is sell today, but don't forget that markets can be very unstable, so don't stop here. According to our 1 week rating the USDCAD shows the sell signal, and 1 month rating is neutral. See more of USDCAD technicals for a more comprehensive analysis.