USDINR trade ideas

Indian Rupee Faces Headwinds But May Outperform in BondsThe Indian rupee is currently facing pressure due to a combination of factors:
* **Weakening Chinese Yuan:** The decline in the Chinese yuan, a key regional currency, is putting downward pressure on the rupee.
* **Potential Portfolio Outflows:** Upcoming elections in India are raising concerns about political stability, which could lead foreign investors to withdraw their money from the Indian stock market, further weakening the rupee.
The Reserve Bank of India (RBI) is likely intervening to support the rupee, but the currency remains near its all-time low.
**Opposition Viewpoint**
Congress candidate Anand Sharma blames the current government's policies for the rupee's depreciation and the wider economic slowdown.
**Brighter Spots for Rupee Bonds**
Despite the short-term challenges, there are positive signs for rupee-denominated bonds:
* **Stronger Macroeconomic Fundamentals:** India's improving economic fundamentals could make rupee bonds more attractive to foreign investors.
* **Market Infrastructure Improvements:** Advancements in India's financial markets are making it easier for foreign investors to enter and exit the bond market.
* **Central Bank Reserves:** The RBI's healthy foreign exchange reserves provide a buffer against external shocks.
* **Inclusion in Global Indices:** The upcoming inclusion of Indian bonds in global indices like JP Morgan and Bloomberg is expected to attract significant foreign inflows.
**Potential Outperformance vs. US Bonds**
Analysts believe rupee bonds could outperform US bonds due to:
* **Potentially Lower Rupee Yields:** Rupee bond yields might fall as US rates decline, making them more attractive to investors seeking higher returns.
**Challenges Remain**
The main risk to this optimistic outlook is a potential rise in global oil prices due to geopolitical tensions.
**Overall**
The Indian rupee is facing near-term headwinds, but the long-term outlook for rupee-denominated bonds appears promising. Stronger economic fundamentals, improved market infrastructure, and inclusion in global indices could attract foreign investments and lead to outperformance compared to US bonds.
USD/INR Long (Buy)
Enter At: 83.6198
T.P_1: 83.8357
T.P_2: 84.2813
T.P_3: 84.8017
T.P_4: 85.4276
T.P_5: 85.7789
T.P_6: 86.1611
T.P_7: 86.4859
T.P_8: 86.8564
T.P_9: 87.5423
T.P_10: 87.9545
T.P_11: 88.6104
T.P_12: 89.0118
T.P_13: 89.4886
T.P_14: 89.8233
T.P_15: 90.6218
T.P_16: 91.3954
S.L: 80.4441

Today USDINR chart Analysis.Hello,
As per today chart Analysis, usdinr support & resistance mark on chart, wait for break out.
our new indicator give market Target touches in future.
as per Indicator gives bullish market of USDINR.
if you like my new AI tool for future market Analysis. like it follow me. share your comment.

Today USDINR analysis.Hello,
As per chart of USDINR show sideway market, support & resistance mark on chart, wait for break out.
as per new indicator analysis, usdinr goes downside to support mark.

Today USDINR chart analysisHello,
as per USDINR chart, support & resistance mark on chart, wait for break out.
as per indicator give buy side signal on chart, please comment me if our indicator give dot to dot target hit.
please share your comment & like my analysis, Support me.

Today USDINR as per chartHello,
As per USDINR chart, shows support & resistance mark on chart, wait for berak out.
as per my analysis its sideway market.

USDINR chart AnalysisHello,
As per chart of USDINR support & resistance mark in chart, overall trade is bullish.
wait for break out.

USDINR Sell opportunity to the 1D MA50The USDINR pair made a direct hit on our 82.700 Target, which we set on our last analysis (January 10, see chart below):
Right now we see the price pulling back within a Channel Down. This is a standard pattern within the long-term Rising Wedge pattern, which as you see out of 7 Bearish Legs all broke below the 1D MA50 (blue trend-line) and only 1 managed to make just a hit-and-rebound.
As a result we are going for a moderate sell Target at 83.100 and then we will reverse to buying, targeting Resistance 1 at 83.700.
-------------------------------------------------------------------------------
** Please LIKE 👍, FOLLOW ✅, SHARE 🙌 and COMMENT ✍ if you enjoy this idea! Also share your ideas and charts in the comments section below! This is best way to keep it relevant, support us, keep the content here free and allow the idea to reach as many people as possible. **
-------------------------------------------------------------------------------
💸💸💸💸💸💸
👇 👇 👇 👇 👇 👇

Today USDINR chart Analysis.Hello,
As per chart USDINR up side resistance mark as red colour & down side support mark as green colour. blue line mark as pivot point. wait for break out.
as per my analysis bullish of USDINR

Today USDINR chart level MarkHello,
USDINR support (red) & resistance (Green) level mark, wait for break out. black line mark as stop loss or pivot line.
today overall market is bullish trend

Today USDINR level Markhello,
today USDINR level mark on chart, wait for break out.
upside resistance are mark & below support line.
overall today USDINR bullish side.
if u like my analysis like & share. with our new indicator market support & resistance automatic mark on chart only trade as per Break out.

Today USDINR level markhello,
As per USDINR chart, still goes down side to retest the level, than goes up. wait for level break.all ready level given last day.
if u like my analysis like & share, comment me for more information about new indicator.

Today USDINR as per chart.Hello,
As per chart, USDINR retest down side support 83.3476 / 83.2427 /83.1754 / 83.1051/83.0586 than upside moment show.
wait for level break.
if u like my analysis & new indicator for help to find out market support & resistance in live.

Today USDINR as per ChartHello,
As per USDINR chart upside resistance level mark 83.5545 /83.6355 /83.7931 /83.8480 pivot line 83.4630 & down side support 83.3437 /83.2422 / 83.1754.
as per my Analysis usdinr still very bullish. wait for break out.
Please Like & Follow me, Give comment u like.

today USDINR level Markhello,
TODAY USDINR level Mark, for upside resistance is 83.3278 /83.3660 /83.3956 /83.4411 for upcoming days. & downside support is 83.1016 /83.0759 black line mark as stopples.

today USDINR level markHello,
Today USDINR level mark on chart, upside resistance is 83.1021 /1274 / 1295/1857 level mark on chart & support 83.00/ 82.9825

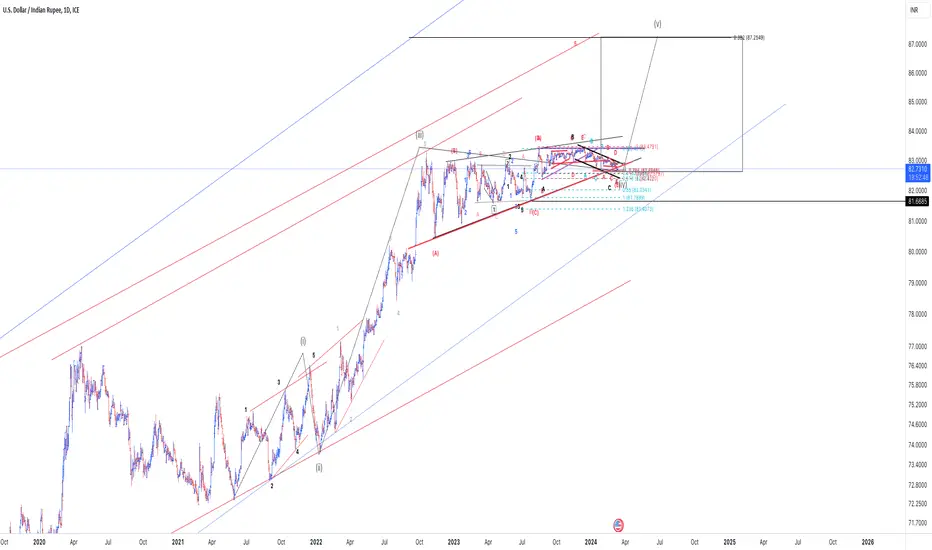
USD INRUSD INR EW analysis is shown on the chart where Waves 1,2,3,4 are done and 5 move is pending as per the analysis
USD INR long term trendUSD INR long term trend showing the support and resistance and price action channels. The analysis starts way back on 2014.

USD/INR sale nowHi everyone! USD/INR pair long was in one range, thereby a narisova a triangle. Now the price drew already 2/3 triangles. Therefore it is possible to expect it breakdown in the nearest future. I expect breakdown of a triangle down. Now the price is close to the upper bound of a triangle therefore the entrance to the transaction is safe. Stop loss can be delivered above a triangle, that is on breakdown up. I consider that the price as a result all the same will achieve the designated objectives (even at breakdown up and leaving up to 88). Technical indicators nap week and monthly schedules showed a turn long ago. So, I sold at the current price 82.53 with the purposes:
TP1 = 80.91
TP2 = 79.05
Information provided is only educational and should not be used to take action in the market.

USDINR : pair looks bearish rounding top like formation in pair indicates lack of srength at higher zones and as long as pair is below 83.20 , it could slip to 82.50 and 82.30 levels

USD/INR BOX FORMATION FOR ABOUT 175 DAYSJust look at the chart here, after breakout it is consolidating for almost 175 days in a box formation now its time for the dollar to either move upward breaking the box or it might be a bearish checkmate hope we will be taking positions after getting some further confirmation till then just wait for the confirmation to take any position

USDINR - Short term looks for Bullish rallyUSDINR:
1. The dollar pairs is being consolidated into a proce bound range for couple of days.
2. Now break out has potential upside of 3-4% from current price with more increase in volume
3. With stop of 82.99 one can go long for target of 83.44-----83.87 & then 84.10++ Levels.
For more techincal analysis and trading ideas, follow me!

usdinr, alarming bell I believe the market is being managed due to the election year, Jun 24 will be very crucial, it seems the market will go down once the result is declare or after some time.
as usdinr is consolidating on the monthly chart in a very narrow range, an upside breakout is not good for equity .let's hope it breaks down
