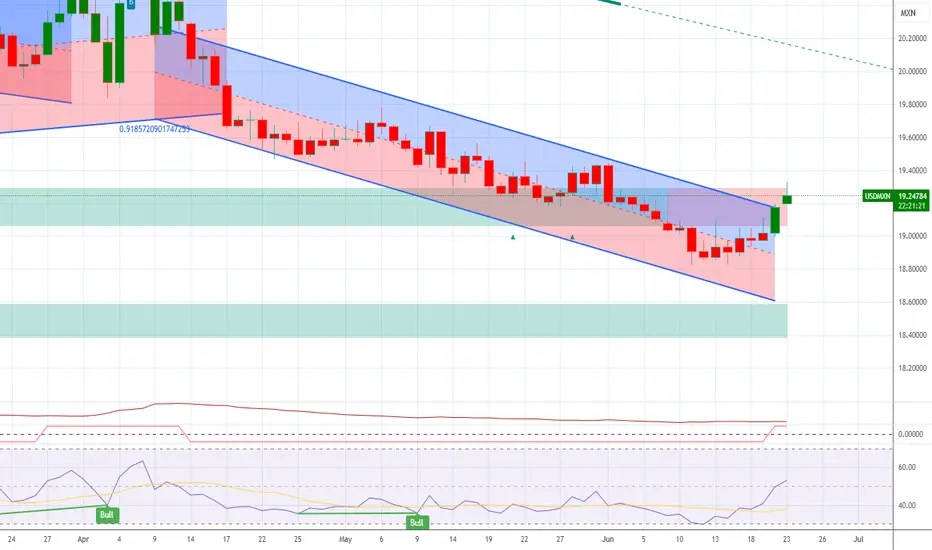
USDMXN OverextendedZooming out to the bigger picture, we can see that we are approaching a strong support level around 18.60 (green zone), with bearish RSI divergence.
There is a high probability that this zone will serve as a catalyst for USD strength, at list in the short term.
Initial targets would be:
minor blue
Related currencies

USDMXN | 26.06.2025BUY 18.8700 | STOP 18.8100 | TAKE 18.9500 | The Bank of Mexico will probably not increase interest rates in the coming months. we expect the pair to resume its growth towards the level of 19.0000.

Is Mexico's Peso at the Crossroads?The recent imposition of U.S. sanctions on three Mexican financial institutions - CIBanco, Intercam Banco, and Vector Casa de Bolsa - has ignited a crucial debate over the Mexican peso's stability and the intricate dynamics of U.S.-Mexico relations. Washington accuses these entities of laundering mi

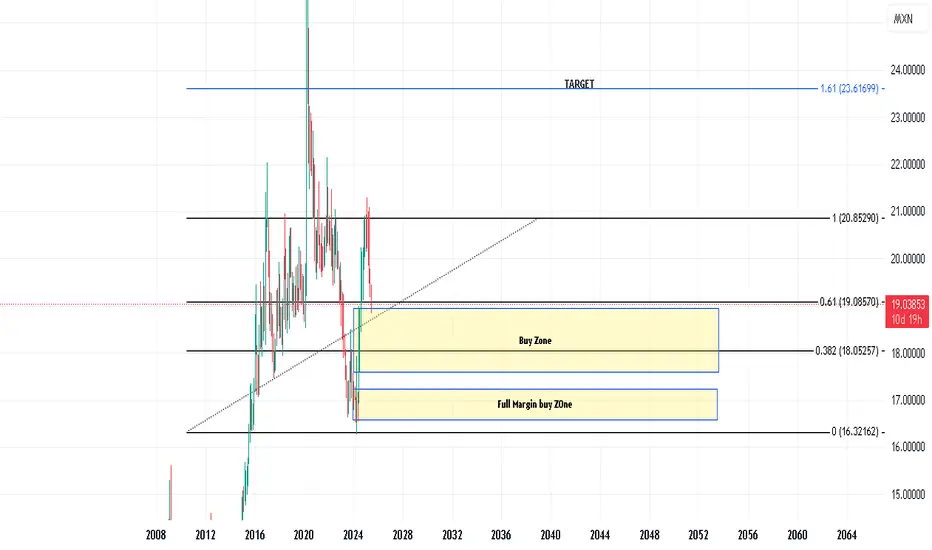
USDMXN LongUSDMXN is now net long the regression break.
It seems there is theme building of US$ strength after a long down-trend.

USDMXN | 21.06.2025BUY 19.1500 | STOP 18.7500 | TAKE 19.7000 | The Bank of Mexico is expected to continue its rate easing cycle next week, despite recent reports on Mexican inflation suggesting risks are skewed to the upside. Inflation in May exceeded the bank's 3% target, raising concerns that the central bank will c

USD/MXN: Bearish Momentum Persists, Testing Key SupportUSD/MXN continues to grind lower, maintaining a persistent downtrend that has remained intact since mid-April. The pair is currently hovering near a short-term support area just above 19.00, with little sign of bullish reversal as of now.
🔍 Technical Breakdown
Bearish Structure: Price remains below

USDMXN: The Mexican Peso Continues to StrengthenOver the last four trading sessions, the USD/MXN pair has dropped more than 1.5% in favor of the Mexican peso as the U.S. dollar continues to weaken in the short term. The index that measures the strength of the U.S. dollar (DXY) remains consistently below the 100-point level, highlighting the broad

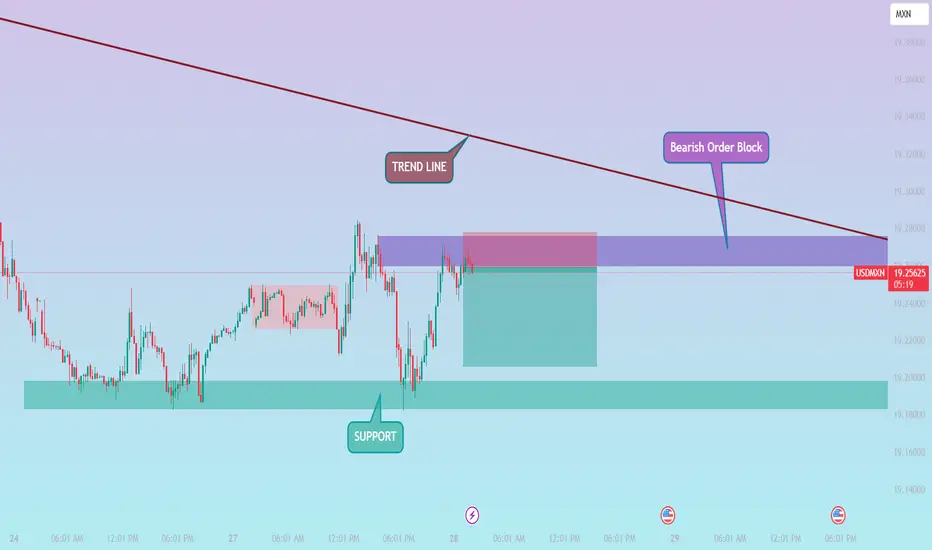
USD/MXN Short Trade SetupA clean rejection is observed from the bearish order block zone between 19.27627 – 19.25936, aligning perfectly with a descending trendline resistance. Price has reacted to this premium level with clear signs of selling pressure.
This setup offers a high-probability short opportunity with the entry
See all ideas
Summarizing what the indicators are suggesting.
Oscillators
Neutral
SellBuy
Strong sellStrong buy
Strong sellSellNeutralBuyStrong buy
Oscillators
Neutral
SellBuy
Strong sellStrong buy
Strong sellSellNeutralBuyStrong buy
Summary
Neutral
SellBuy
Strong sellStrong buy
Strong sellSellNeutralBuyStrong buy
Summary
Neutral
SellBuy
Strong sellStrong buy
Strong sellSellNeutralBuyStrong buy
Summary
Neutral
SellBuy
Strong sellStrong buy
Strong sellSellNeutralBuyStrong buy
Moving Averages
Neutral
SellBuy
Strong sellStrong buy
Strong sellSellNeutralBuyStrong buy
Moving Averages
Neutral
SellBuy
Strong sellStrong buy
Strong sellSellNeutralBuyStrong buy
Displays a symbol's price movements over previous years to identify recurring trends.
Frequently Asked Questions
The current rate of USDMXN is 18.73962 MXN — it has increased by 0.05% in the past 24 hours. See more of USDMXN rate dynamics on the detailed chart.
The value of the USDMXN pair is quoted as 1 USD per x MXN. For example, if the pair is trading at 1.50, it means it takes 1.5 MXN to buy 1 USD.
The term volatility describes the risk related to the changes in an asset's value. USDMXN has the volatility rating of 0.24%. Track all currencies' changes with our live Forex Heatmap and prepare for markets volatility.
The USDMXN showed a −1.87% fall over the past week, the month change is a −2.92% fall, and over the last year it has increased by 2.11%. Track live rate changes on the USDMXN chart.
Learn how you can make money on rate changes in numerous trading ideas created by our community.
Learn how you can make money on rate changes in numerous trading ideas created by our community.
Currencies are usually traded through forex brokers — choose the one that suits your needs and go ahead. You can trade USDMXN right from TradingView charts — just log in to you broker account. Check out the list of our integrated brokers and find the best one for your needs and strategy.
When deciding to buy or sell currency one should keep in mind many factors including current geopolitical situation, interest rates, and other. But before plunging into a deep research, you can start with USDMXN technical analysis. The technical rating for the pair is sell today, but don't forget that markets can be very unstable, so don't stop here. According to our 1 week rating the USDMXN shows the sell signal, and 1 month rating is sell. See more of USDMXN technicals for a more comprehensive analysis.