TLDR: SELL Gold, BUY OilGold/oil ratio seems to be evolving in a band. We've had RSI divergences every time we touched the band predicting trend reversal. RSI Divergence playing out right now as we touch the seemingly relevant support.
- FX_IDC:USDWTI / FRED:WM2NS is at an all time low support level (1998, 2016, 2020

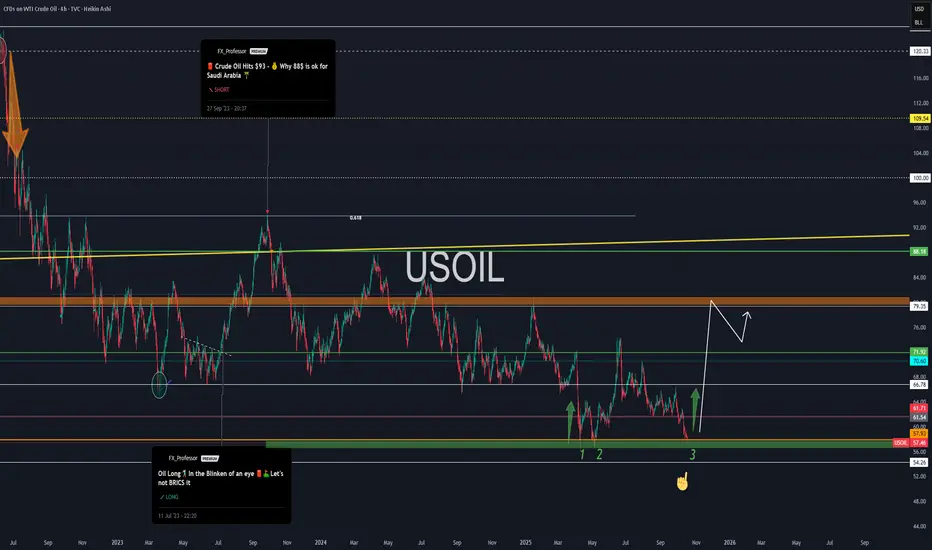
Hellena | Oil (4H): SHORT to support area of 56-57.Colleagues, price is actively moving in a downward direction and I believe the move is not yet complete.
Earlier I saw this move as a big correction, but now the structure is more of an impulsive one. This means that the price is moving in the wave “3” of the higher order (Red), which should be com

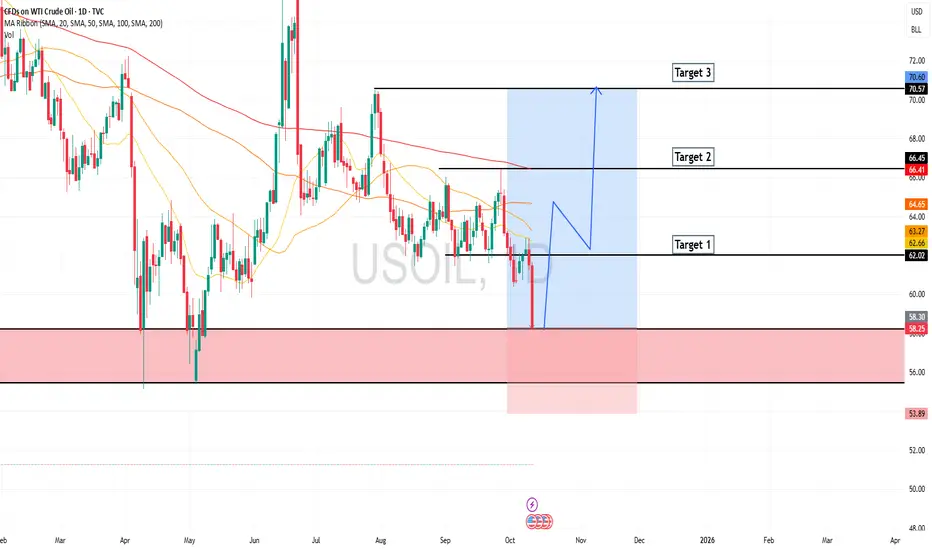
Oil’s Bottom Is on Its Last Breath — A Major Rally Is ImminentPrevious analysis:
Update is on the chart above 👆
The downside we were hunting looks near completion; in time terms, the correction also appears done.
Wave structure points to the end of wave 2 and the start of a powerful wave 3 up. Failed downside breaks and liquidity sweeps of recent lows back

19.10.25 Crude Oil WeeklyOil is about to approach the Weekly Demand Zone
Weekly (Higher Time Frame)
The Weekly Demand have 3 basing candle's: the Basing candle are so small it means price have been in balance til the buy pressure came in.
Also you the Demand zone was formed in a previously Supply zone. It means Supply b

Heading into 50% Fibonacci resistance?WTI Oil (XTI/USD) is rising towards the pivot which is a pullback resistance that aligns with the 50% Fibonacci retracement and could reverse to the 1st support.
Pivot: 60.56
1st Support: 57.68
1st Resistance: 62.10
Disclaimer:
The above opinions given constitute general market commentary, and d

Time to Fill Up Those Tanks — WTI Reversal in PlayTime to Fill Up Those Tanks — USOIL Reversal in Play 🛢️📈
Everyone’s watching tech, AI, Bitcoin, and gold.
But let’s be real: none of that moves without oil.
We all need black energy — whether you call it crude, petroleum, or the global bloodstream of industry. And today, we’re looking at a setup t
WTI (Crude Oil) — Bullish Bat in ProgressOANDA:WTICOUSD
A bullish Bat pattern is currently forming, with a potential completion near $57.86 — the 88.6% Fibonacci retracement of the prior leg.
If the pattern confirms, it could trigger a bullish move toward $65.70, aligning with the 38.2% retracement level.
Price action around $57–58 w

XTIUSD possible pullback set up Long The oil price fallen drastically and now price has crossed the trendline but has not crossed the cloud , price within the cloud and possibly may break resistance . Since it’s at support you can buy with very small stop loss .

XTI/USD Chart Analysis: Oil Price Falls Below $60XTI/USD Chart Analysis: Oil Price Falls Below $60
Friday’s comments from President Trump about the potential introduction of 100% tariffs on trade with China pushed WTI crude oil below the $60 level for the first time in four months. The bearish sentiment stemmed from fears of a global economic sl

The US-Oil will jump from the historic Support LevelHello Traders
In This Chart US-OIL HOURLY Forex Forecast By FOREX PLANET
today US-OIL analysis 👆
🟢This Chart includes_ (US-OIL market update)
🟢What is The Next Opportunity on US-OIL Market
🟢how to Enter to the Valid Entry With Assurance Profit
This CHART is For Trader's that Want to Improve Their
See all ideas
Displays a symbol's price movements over previous years to identify recurring trends.