Avatar_Trading
PremiumNetflix appears to me to be completing a large cup and handle pattern. The initial peak of the cup appears at a price level of about $485 while the base appears to be at a low of $345. This price difference is $140, so I suggest the possibility that a new price target for NFLX should be at $625. The handle has just been broken in the upward price direction and I...
With (hopefully) the most disappointing earnings reports behind us and depending on the news over the weekend, I'll be ready Monday to look for a move, from bulls or bears, that rebounds off the buy zone of ($386.96 - $389.29). I will note, while I acknowledge the possibility of a bearish move above, the bulls seem to have considerable advantage considering the...
BNTX is finally concluding a year long descending triangle pattern. I see a low risk entry at $150 and will be buying. Stop loss set at $138.49, risking about 8.5%. If we see a large move upward, I could see the stock retesting both its 200 day moving average (likely at $183) and its next major resistance after that at $295. A potential of nearly 100% profit (not...
After Cardano's latest highs, and most recent pull back, it appears to me as if ADA is ready to begin a retest of its all time highs. There has been some recent developments for cardano, including the release of smart contracts, new development of dapps, and the holding of the cardano summit (last weekend). This gave the crypto community new information to digest...
The SPY has retraced fully based on its Fibonacci levels from its latest move down. I'm waiting to see whether it continues back down after violating the rising wedge trendlines earlier this week. At first glance the rebound seemed convincing, but I would have been more sure if the volume that accompanied the rally was less anemic. I feel a strong move coming but...
Apple has broken out of a symmetrical triangle to the upside that has been consolidating since late January. Call volume has been very bullish today as well as the past week. I am looking for a move much higher over the coming weeks. The federal reserve meetings have reassured folks enough that it seems tech is off the hook for the moment. The difference between...
I’ve been monitoring GME the last few days. I noticed a bearish engulfing pattern appear on the daily chart this Friday indicating a possible move downward. Was lucky to catch it on the way up last week for gains of >500% so I’m working w/ profits on my current position. Clearly a volatile situation, good luck to all.
Looks like a death cross has formed on the daily chart for zoom. I’ve initiated a short position. Good luck to all.!
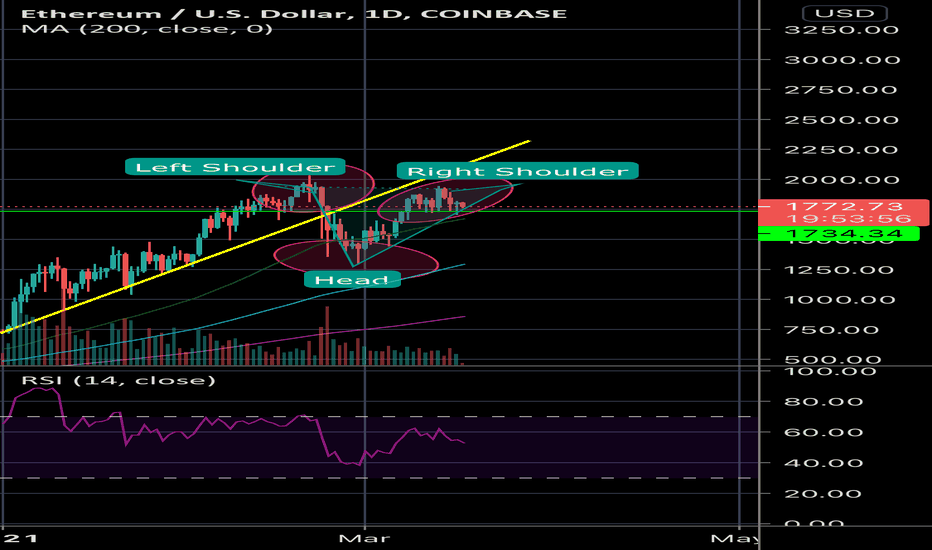
Looks to me as if $eth is forming an inverse head and shoulders pattern on the daily chart. Head is at ~1300 and shoulders are ~1900. If calculations are correct and price action w/ accompanying volume breaches the upward neckline my target would be set for ~$2500. Potential catalysts driving this move being massive mainstream adoption from US equity's and retail...
Chart speaks for itself. Reverting to the long term upward trend perhaps?
Disney over the last week or two seems to have formed multiple tops and bottoms at about 137 and 131 respectively. At least in the short term I'm expecting that to continue. I dont think I need to state the obvious on when to go long/short, but watch the RSI/volume and should this trend be broken, consider either of these points could flip to be a resistance/support.
Kinda looks like a cup and handle has formed. Usually a bullish sign. We’ll see !
Abbvie has progressed towards its previous resistance and looks to be testing its last high. I am planning on watching for a bullish move that breaks this resistance and will hold the trade until the RSI trend line is broken or until the Fibonacci take profit zones have been reached. Dont be surprised if it takes a day or two to develop but the time frame of...
Noticed a potential for this pattern to play out. Watch over the coming days to see if the neckline is broken leading to new lows for WMT


