It is expected that the upward trend will advance to the specified resistance range and then we will see a change in trend and the beginning of the downtrend. If the index crosses the resistance range and consolidates above this range, the continuation of the upward trend will be likely.
It is expected that the upward trend will pass the resistance range and with the stabilization above this range, we will see the continuation of the upward trend. If the price crosses the support trend line, the continuation of the correction will be formed. And with the failure of the support range, the beginning of the downtrend of the scenario will be likely.
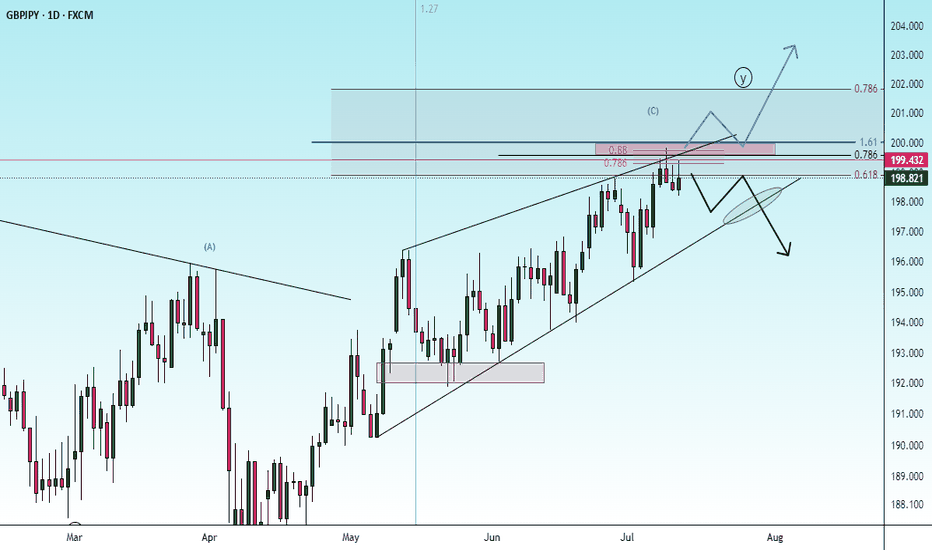
Considering the price behavior in the current resistance range, possible scenarios have been identified. With the resistance range broken and stabilized above, a continuation of the upward trend is likely.
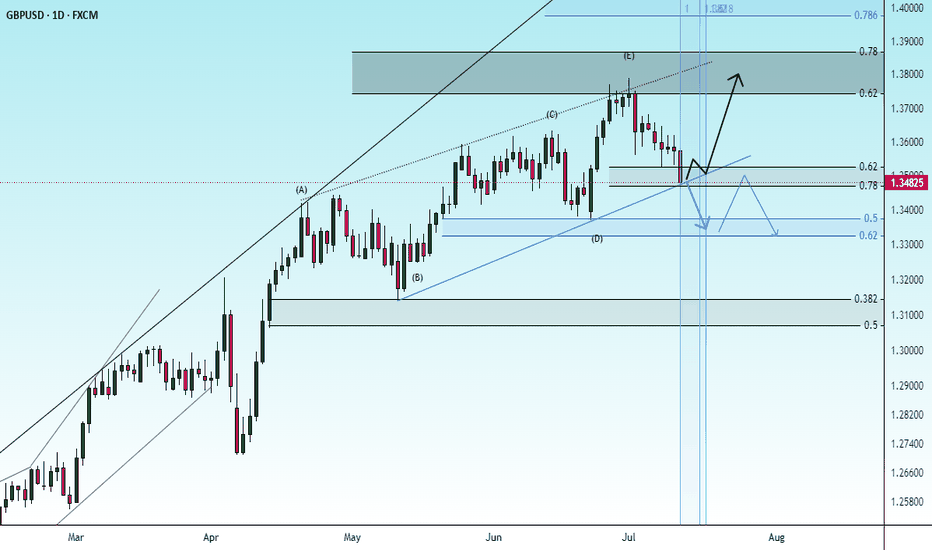
With the current support range broken, a continuation of the downward trend to the next support levels is possible. Otherwise, with the support range stabilized above, an upward trend to the specified resistance levels is possible.
Considering the price behavior in the current resistance area, possible scenarios have been identified. If the price breaks through the resistance area, the continuation of the upward trend will be likely. Otherwise, a downward trend is possible with the support trend line broken.
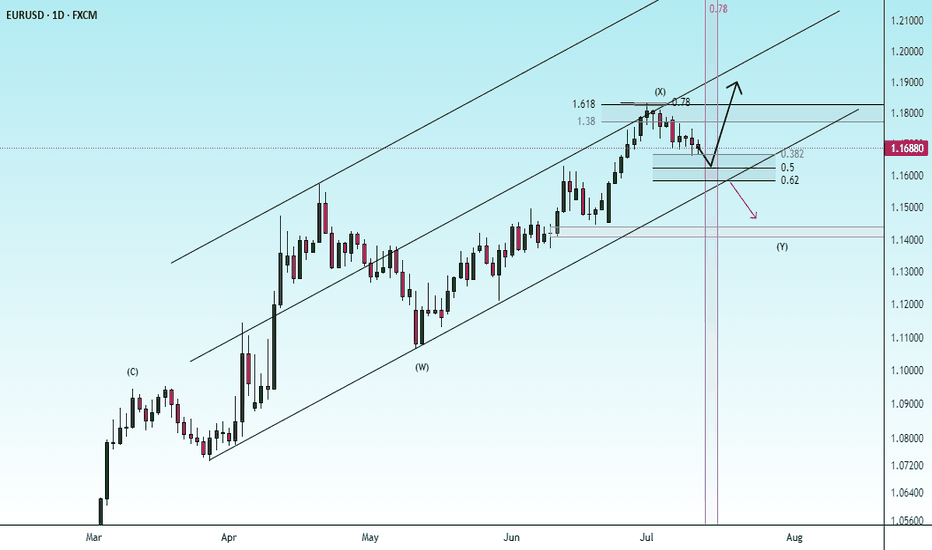
The correction trend at the support levels and the support trend line is expected to end and then we will see the start of the upward trend. Otherwise, the continuation of the downward trend with the breakdown of the support area will be possible.
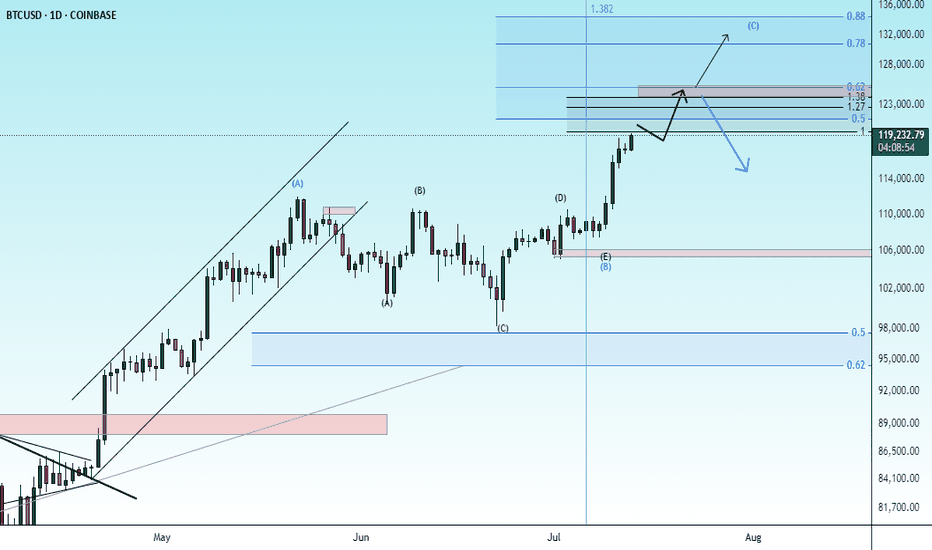
The price is expected to break through the resistance area and continue the upward trend according to the specified path. If there is strength in the upward trend, a c wave can be drawn.
It is expected to fluctuate within the current support level and then continue the upward trend. If the index breaks through the green support level, the correction to the next support level is possible.
The correction is expected to move in the specified direction and the correction pattern is completed. Then, we are expected to see the start of the upward trend.
The bullish pattern is expected to advance along the specified path to the specified resistance levels. Then there is a possibility of a trend change. If the support area is broken, the continuation of the downward trend is likely.
Considering the price behavior within the current support range, possible scenarios have been identified. It is expected that a trend change will form within the current support range and we will witness the start of an upward trend. Otherwise, the continuation of the downward trend to the next support levels is possible.
It is expected that after some fluctuation and correction, the upward trend will continue. A break and consolidation above the resistance trend line will be a confirmation of the upward trend. Otherwise, a continuation of the downward trend with a break of the green support range will be possible.
It is expected that a trend change will form within the current support range and we will witness the start of an upward trend. If the price breaks through the support range, a continuation of the downward trend will be likely.
As long as the price is above the green support range, the continuation of the upward trend is likely. Upon reaching the 100% level, a correction trend will probably form.
It is expected that the correction trend will continue to form until the specified support levels. Then there will be a possibility of a trend change. The specified time frame can cause a trend change on the chart.


