TrendDiva
PremiumLooking at GBPCHF and how it fits within my approach to structure-based trading, this one is really speaking my language. Price has come down into a key higher-timeframe support zone: a zone that’s proven itself multiple times in the past. Now, price has shown some initial rejection there, making my long position towards 1.1000 a clear, rational target. What...
The current market context on EURJPY shows an overextended move that has been pushing higher as price is about to reach a well-established daily resistance. The rally into this resistance lacks healthy retracements, and momentum is likely unsustainable without a deeper correction. The probability of a pause or reversal here under this circumstances increases...
Looking at the chart and the overall structure, I think we can favor the continuation setup with a emphasis on price action at key zones, particularly when price breaks out then can revisit this structure for a retest. This bounce off support has been accomplished in my previous analysis: Here, if price breaks with strength and dips back into the area and holds...
The market on this pair shows us a classic scenario where price presses into a resistance zone after a sustained bullish move. Price action approaching this zone appears hesitant, with smaller candles and wicks showing signs of exhaustion, meaning the possibility that buying momentum is weakening. There is a clear intention in this structure and I am anticipating...
GBPCAD descended with strength, and has now reached a strong support zone. Price now hovers above and this zone and is a great indication to use for possible reversal move, that could send price into the 1.86100 level. But if price breaks below support with momentum, then I’ll back off this bullish bias and reassess, and consider the reversal idea invalidated,...
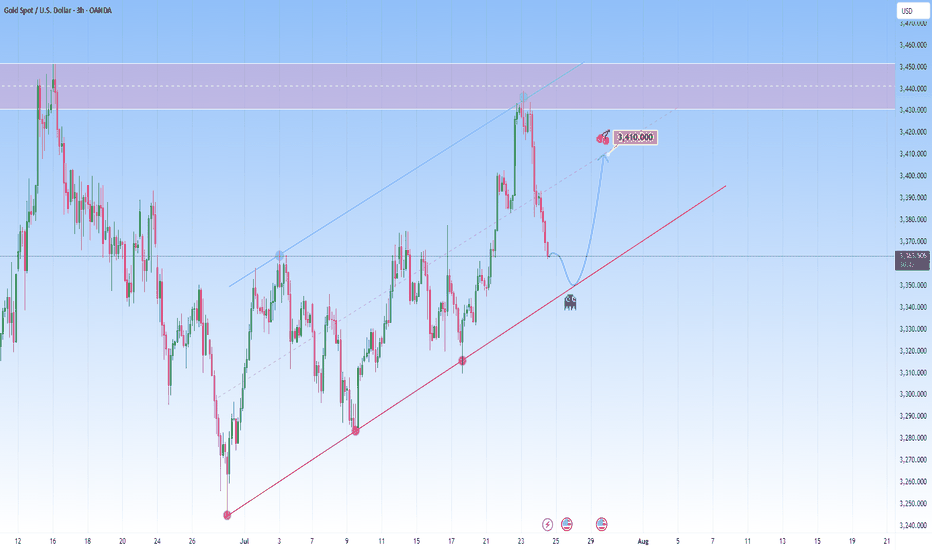
From a technical perspective Gold is climbing in a parallel channel, clearly bullish with a rhythm that’s hard to ignore. Price just bounced off the resistance with force, a classic overextension flush. And the market is now approaching the lower boundary of this projected channel. This confluence of technical support is likely to attract renewed buying interest....
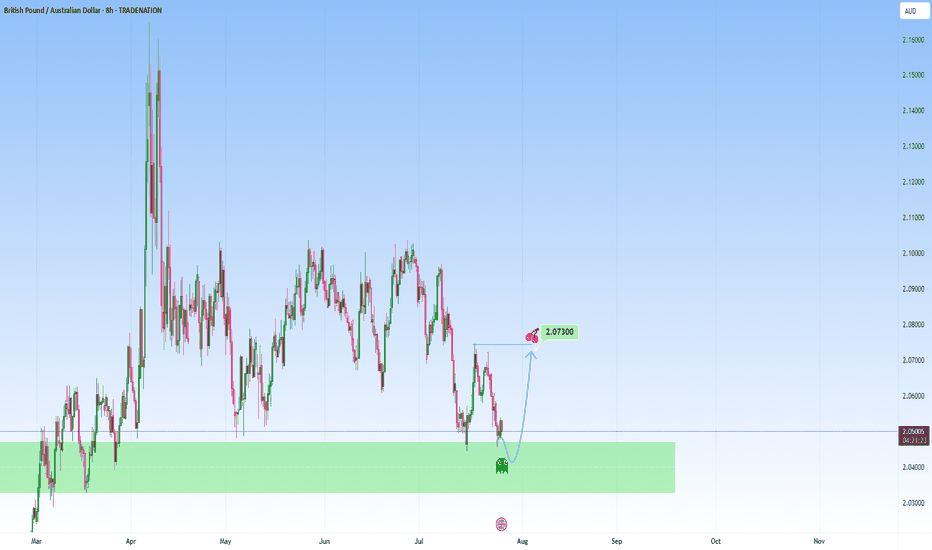
I am watching for a possible reversal GBPAUD, expecting a rejection with a upside target at around 2.073. This area is where it can become a decision point, either price finds support and bounces, or it breaks below, and the move can start to extend lower. Just sharing my thoughts for the charts, this isn’t financial advice. Always confirm your setups and manage...
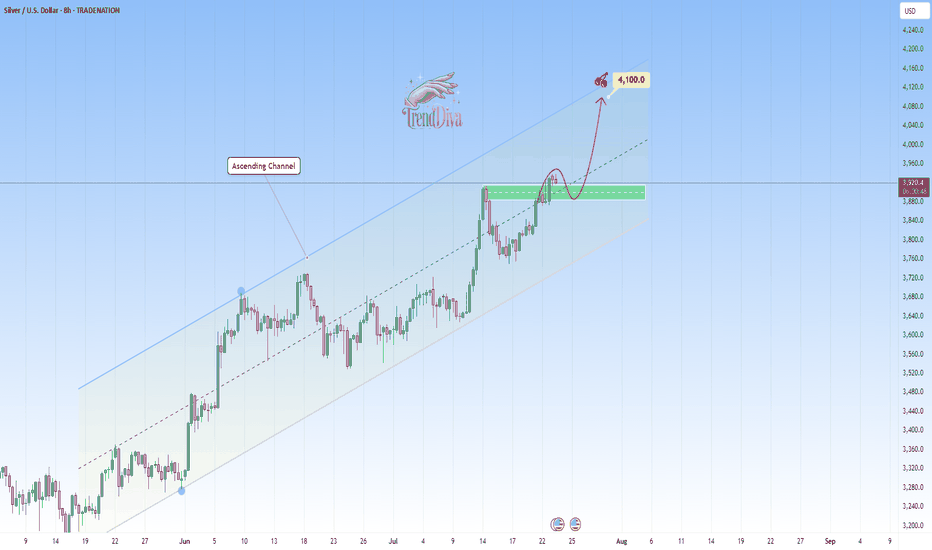
TRADENATION:XAGUSD is trading within a clear ascending channel, with price action consistently respecting both the upper and lower boundaries. The recent bullish momentum indicates that buyers are in control, suggesting there's chances for potential continuation on the upside. The price has recently broken above a key resistance zone and now came back for a...
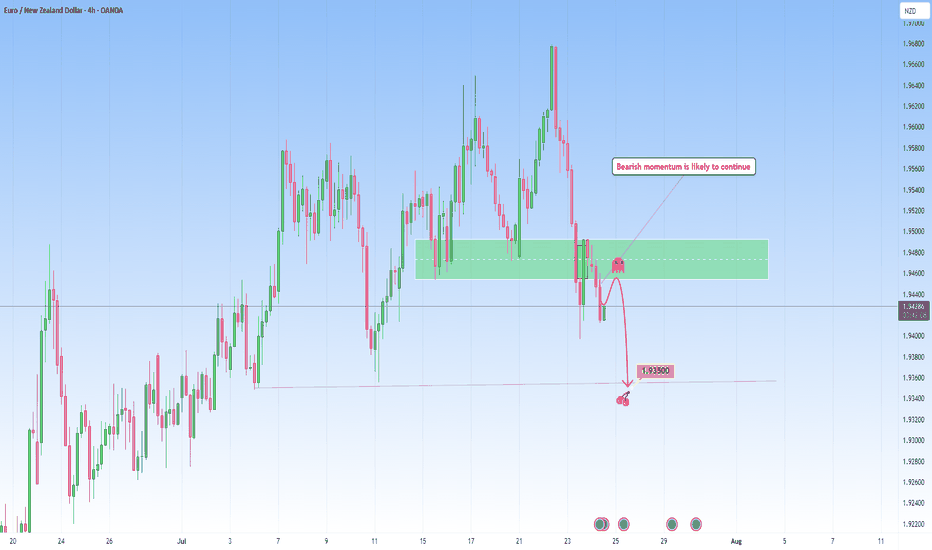
The market has recently pushed down with momentum. Price attempted a timid "echo bounce" back into the broken support but was rejected, confirming this area now serves as area for bearish re-entries. From what I can tell, we're entering the next leg of what I call the “Gravity Spiral Phase”, where sellers take over after taking a clear zone. Each wave down is...
The most recent move on NAS100 saw a sharp drop that briefly recovered, likely triggering stops before aggressively reversing from the lower boundary of the newly projected channel. This isn't a cause for concern, on the contrary, it's another opportunity to get involved. That is because this drop and recovery is a common behavior in strong uptrends before...
I am watching for a reversal here EURAUD as marked on my chart, expecting a rejection with a upside target at around 1.798. This are is where it can become a decision point, either price finds support and bounces, or it breaks below, and that’s when we might see the move start to extend lower. If we get a decisive move upside, my next area of interest is marked...
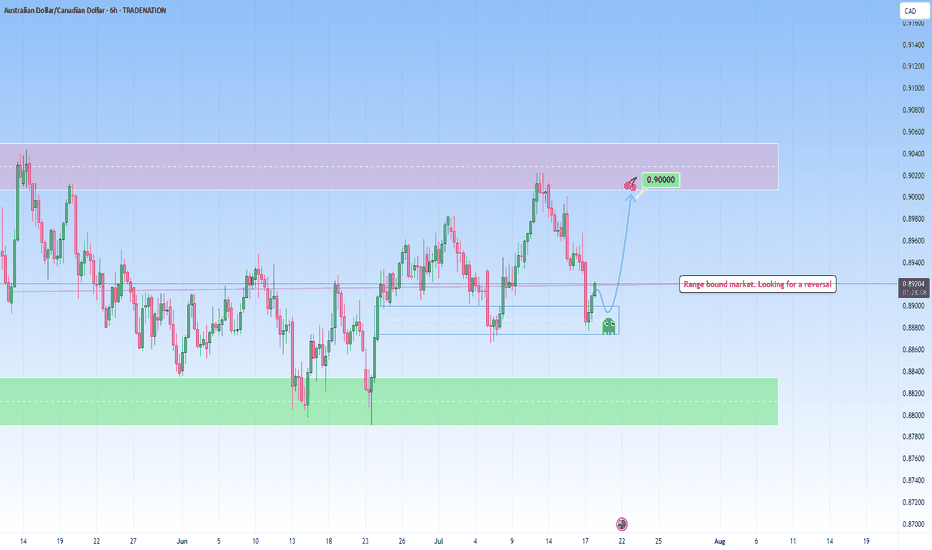
What we’re looking at here is a beautifully balanced range market, the kind I love trading, because it speaks so clearly when you take a moment to listen. Price is respecting both sides of this range clearly. The lows are being protected and respected multiple times before. We’ve already tapped into that lower bound, and the reaction has been good, together with...
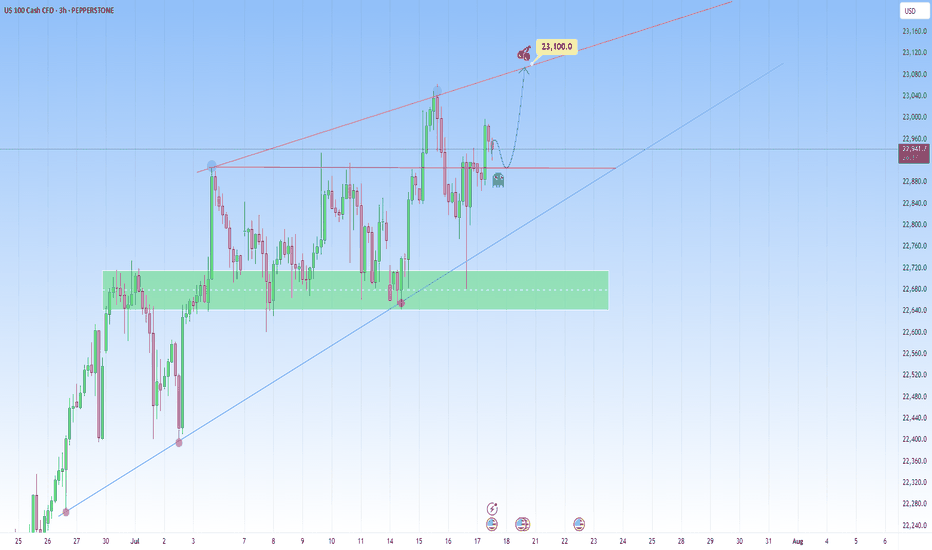
Looking at the current structure through the lens of a trend trading approach, what we saw on NAS100 is more than a simple price bounce, it’s a trend continuation trading within a high-volatility environment. As price is approaching a key resistance level, how price is behaving around this dynamic trendline will be key. This recent retracement and rejection...
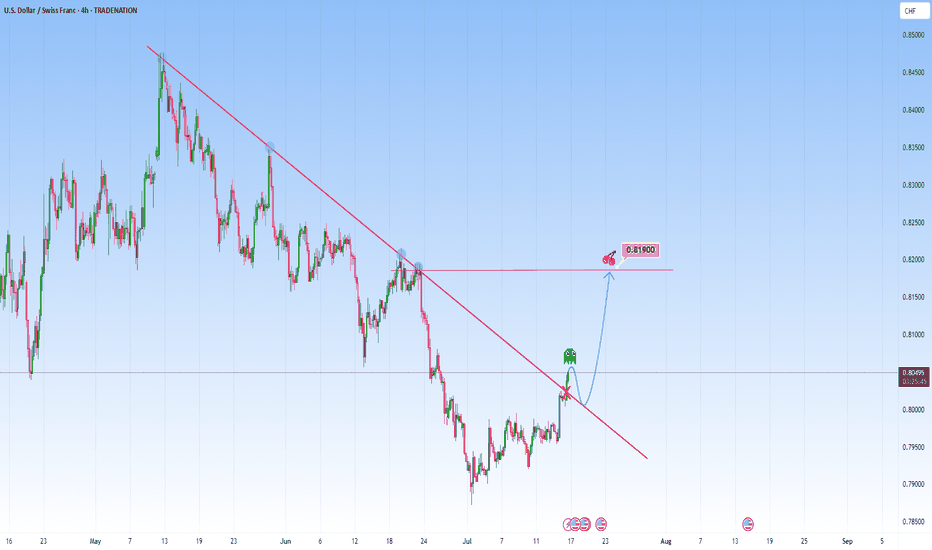
The price action on the USDCHF presents an opportunity of structural transition. The descending trendline has acted as dynamic resistance, has contained each rally attempt beautifully. This trendline is marked by multiple rejections, reflected bearish dominance, a controlled downtrend in motion. The recent movement though could signal a shift. The market has...
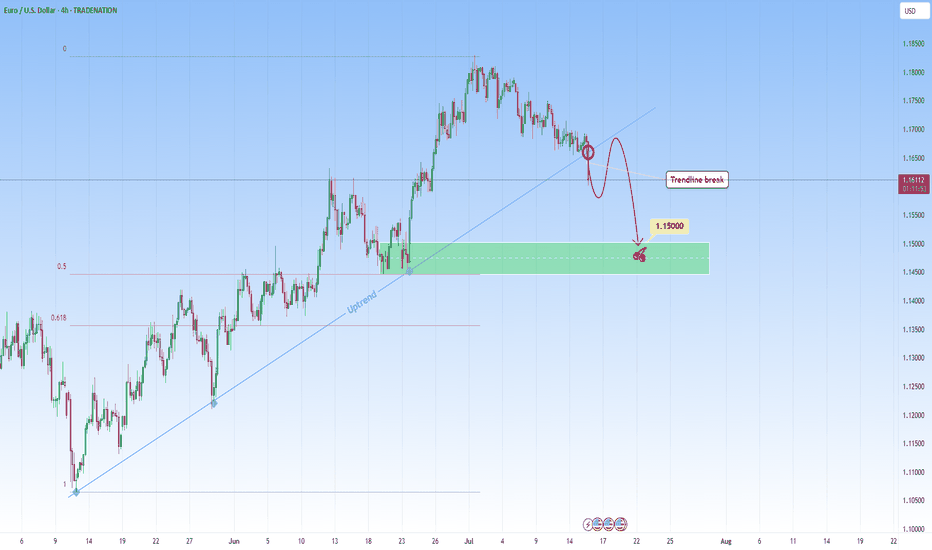
EURUSD was in a steep uptrend but it might stop with this recent break through the uptrend. A break like this one on a strong trendline that had multiple touches, indicates either a potential reversal or major pause in the trend. This candle that broke the trendline signals the first hint of structural change. I will be waiting for a retest and look to get...
ALUMINIUM climbed a steep uptrend but it might meets its end with this recent break through this rising trendline. When price respects a trendline repeatedly, it becomes significant, its break indicating either a potential reversal or major pause in the trend. The candlestick that broke the trendline signals the first hint of structural change. After breaking,...
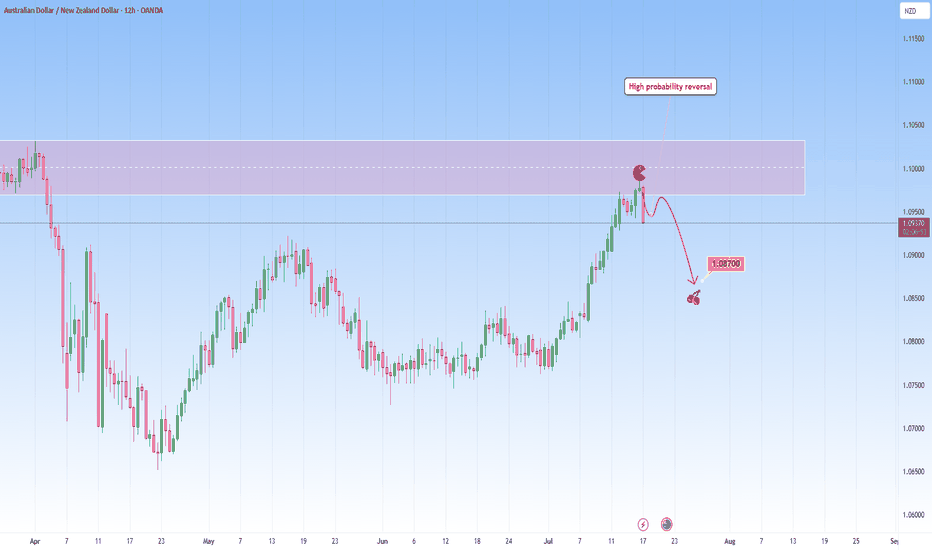
I am watching for a reversal on AUDNZD as marked on my chart, expecting a reversal with a downside target at around 1.08700. This is a high probability setup taken into account the overextended upside move to this resistance zone. Just sharing my thoughts for the charts, this isn’t financial advice. Always confirm your setups and manage your risk properly.
Price broke above resistance with a momentum candle, indicating buyer control. This is our first clue that a structure shift might have occurred. This retest is essential. Many traders make the mistake of entering too early without confirmation. But it's right here, once price touches the former resistance, that you must observe how price reacts. Look for price...


