bitcoin
# **Understanding Alt Season in Cryptocurrencies: A Deep Dive** In the dynamic and often unpredictable world of cryptocurrencies, one phenomenon that excites traders and investors alike is known as **"Alt Season."** This term has become increasingly popular within crypto communities and social media platforms, especially during bull markets. But what exactly is...
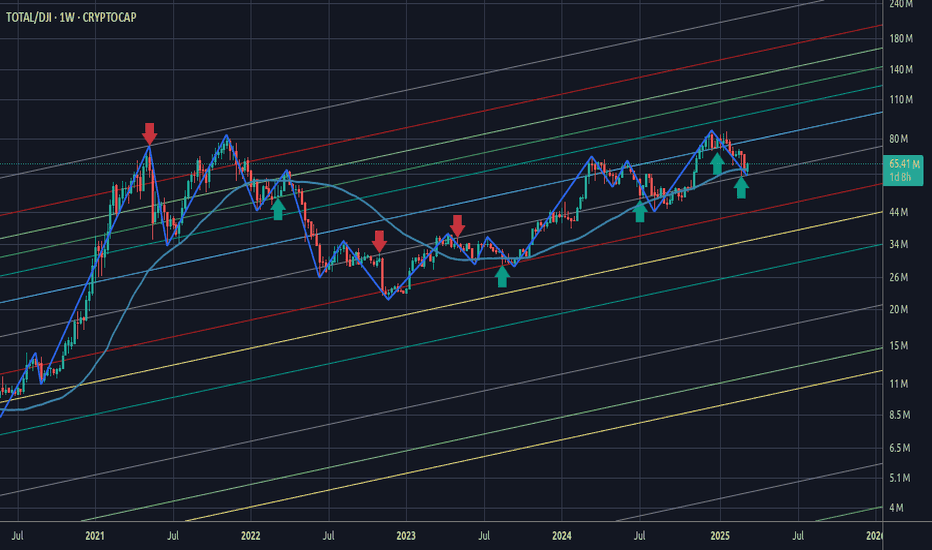
### Money Flow Spread from DJI to Cryptocurrency: A Fibonacci Perspective The financial markets operate in an interconnected ecosystem where capital flows between asset classes based on macroeconomic trends, investor sentiment, and risk appetite. One such dynamic involves the movement of funds from traditional markets like the **Dow Jones Industrial Average...
In the context of technical analysis, Fibonacci retracement and extension levels serve as pivotal tools for identifying potential support and resistance zones within a given price trajectory. By applying the Fibonacci sequence to key swing highs and lows, traders can derive a series of horizontal levels that may act as psychological barriers or areas of confluence...
Looks like Wall Street Money will flow into Crypto Again
Let's keep an eye on this. Looks like alt season is starting...
While Dominance alone doesn't mean much for spot, let's keep this in mind. New cycle already started ?
The purpose of this idea is neither educational neither to explain the market. It is just one perceptive to open possible discussions. The symbol here is total market cap with dollar ( DXY) Factor removed. Time fib suggestion is the new bullish cycle should around January 23. What you think ?
Not too much to say, just saving this for later analysis
Not too much to say, just saving this for later analysis
Nothing much to say, just changing a little bit from crypto
My previous take on DJI got reached ahead of time. Currently I am focusing on improving my time fib skill. So this is my second take on what is next with estimated time and value, included a circle fib just in case I nail everything this time.
Hello guys, another experimental chart using time fib as the main indicator, the circle fib and std fib was used towards the time fib to try to reveal the next move for gold on mid-term scenario. As always, everything you need to know on chart, target value and time with two possible targets on green flag.
More tools you use, greater chance of failure, with failure comes enlightenment and breakthrough to another level. So I put together several tools, published and wait now for time and knowledge to come. Hope this help you too in some way. As always target on green flag ! Please show some support, comment, like and share !
Hello guys, my two previous charts got no hit and this is normal as I am doing experimentation here. Market got sideways after retesting our circle fib much earlier than expected and got into a range, my time fib failed completely and this is exactly something I am working to get better. Ir order to get better results I bring together today in my charts the gann...
Market is always tricky, those who follow me knows I used to have views on both sides of the "coin", in this manner some of my chart could eventually spike some other ideas on both you that are bearish or you bullish. Currently I am trying to improve my last, non standand, not on textbooks, fusion fibs where two or three fib tools work together, be it time fib,...
Hi guys, I got this idea today to use retracement fibonacci but to get it's extended values, combined it with time fibs and circle fibs and see what looks more reasonable. It is just a draft, but I use to publish my drafts so I can check and see it later. I think on the positive scenario halving and usd inflation shall push things upward, not too much to say...
Ok guys, I promise you one positive and another negative analysis so we don't get blind on what is going on. This is the negative one and it is not looking good if you are on the wrong side. Keep this on mind and let's see what happens latter on. The dashed circle curve is the resistence market need to brake in order to go long. Otherwise we might go down A LOT...
Hello guys, I'm back again with mid to long term charts. Looks like my previous take is not going to happen at least on that time. I will try to chart one positive and another negative so I have a better change to improve my time fib skill. Consider these charts experimental or just a draft as this is a WIP. I took the target by crossing a fib circle with a...


