kayb100
LTC printing an interesting pattern where we get a pit of flat price action in between two peaks, then another drop after the second peak, followed by the bull run for LTC
we're at the time in the market where we're going to find out if we've bottomed. Two options for the market here imo. See chart for blue vs red.
After DXY hitting its A target spot on and completing a potential B wave, now its time for the C wave.
i think even though the fundamentals are suggesting more up, chart looks like could be done here, if she starts to drop could be a big one, might be worth considering protecting yourself against any big drops.
check the chart for details, everything is color coordinated to make it clearer, the cycle seems quite clear at the moment.
Based on previous halvings LTC should be in a very bullish period for the next 2 months. Of course if SPY and the big boys start to tank this would be voided so need to keep an eye on SPY/SPX
LTC can hit $550 zone in the next bull market cycle and even has a shot at $1200 but this second target is ALOT less likely. (note - as we havent really confirmed a bull market yet this is unlikely to happen during the halving run up) I've analyzed ETHEREUMS breakout to come up with this price action pathway for LTC. This is of course the bulilsh outlook...
price prediction for the next bull run once we break current ATH's.
obviously its risky to try to put EW on something like the US10Y yield with so many issues in the world right now but i couldnt help notice how clean the count looks at the moment. NOT trading advice.
we've had a such a big long consolidated bottom and we're finally currently testing a breakout zone. Trade: open long if price has a 4hr close ABOVE .236 price (above red line) Target: see chart, as my crystal ball is broken currently, if the alt market starts to stall i will update on here but i think theres a good opportunity we complete 5 waves up as per the...
Quick note: I've been long on BTC from $6600 and have a trailing stop at around $7200 so that if the market turns against my idea i can still get out with a 10% profit. If you enter long at a later stage remember to consider your own risk/reward ratio carefully to your own circumstance/timing when opening a long. Trade: I've been analyzing the 2016 correction...
There's two strong areas to watch that could become great bounce zones and the start of another leg up.
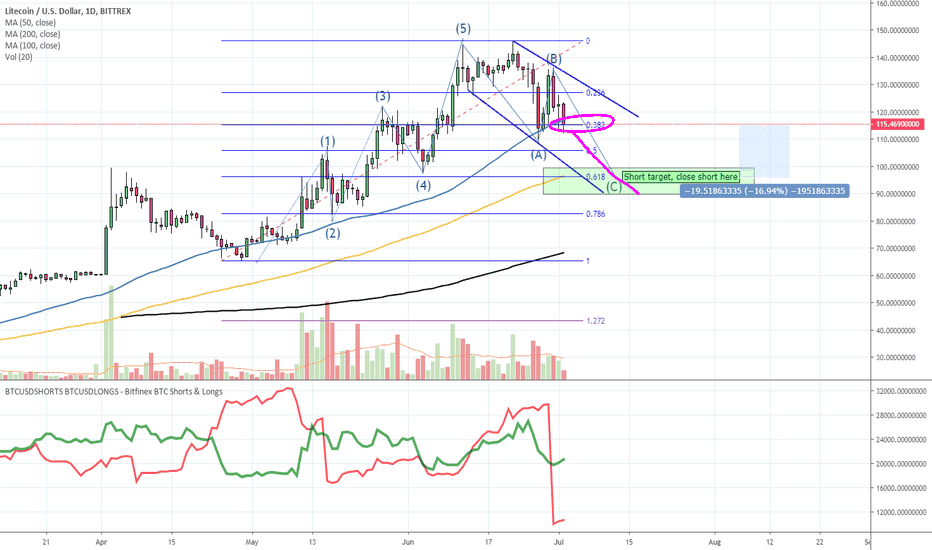
If we close below the highlighted .382 fib level (pink highlight) then this will become a good opportunity to open those shorts We should complete the ABC correction down at the 100 day MA (yellow line) with a target of $100 The 100 day MA has typically been a good support and reversal zone when LTC is falling. This also lines up nicely with the 618 fib of this...
Long opportunity coming up, IF we dip down to the green box area we can open a long up to the next fib level for a nice 8% gain minimum depending on your risk profile. at the 14k top you can see we were rejected off the .618 fib (red font) from ATH, this fib level is usually a strong rejection. a rejection off of a big .618 fib like that should take us all the...
Been riding this entry since $34, the halving pump has meant it could be traded bullishly all the way, i was expecting one final parabolic move to $170-$200 but we cant be too greedy considering the amazing gains its given all the bulls. LTC has formed an evening star pattern on the daily which is a strong reversal pattern, granted it might just reverse $10-$20...
We've got a bear pennant formed + hidden bearish divergence + the market and media sentiment is negative. I believe we'll hit our 9000 and 8000 targets (check charts for exact numbers)
Another good long entry point setting up at around $5400-$5200 region for a nice 5% profit/bounce. Actively manage the trade, if it starts to turn then close the long as this should be an aggressive bounce up, if not, close the long.


