lil_Buuck
I'm tracking a weekly chart that shows signs of a potential cup and handle pattern. While the structure is broadly intact, it's not a textbook formation. Recent market action has been noisy, and that’s reflected in the price and volume behavior. The cup is well-formed: a rounded bottom following a downtrend and a steady climb back to previous highs. The handle...
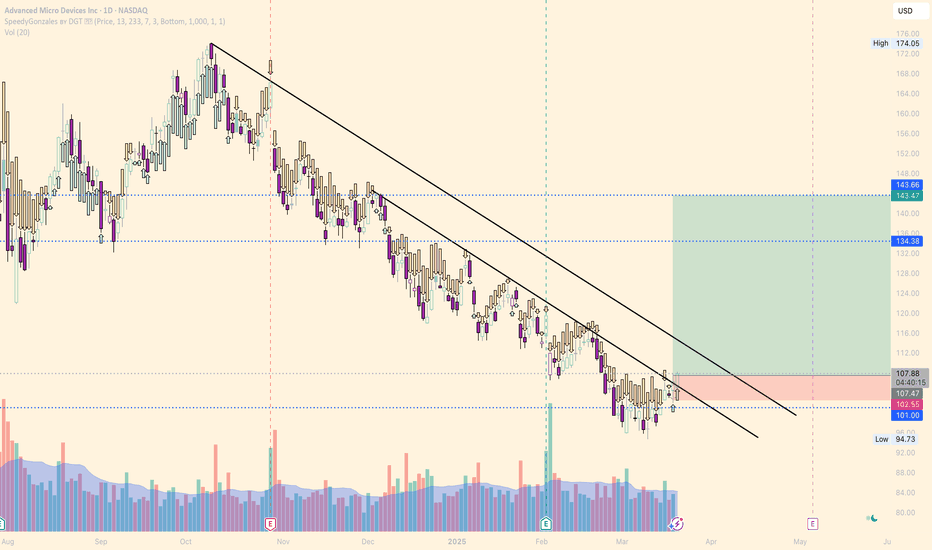
A relief bounce or a reversal? If price can close decisively above the trendline, this could trigger a reversal targeting the $133 level first, with potential to reach the $ 143 zone. Entry price: $107 ish Stop loss: $102 Target: $133 Risk calculation: $107 - $102 = $5 per share risk Reward calculation: $133 - $107 = $26 per share potential reward Risk/Reward...
Looking on the daily timeframe, we've seen a clear downtrend from the $2.24ish highs, with price respecting this descending trendline for months. However, we might be approaching a significant reversal opportunity. If price can close decisively above the trendline, this could trigger a significant rally targeting the $1.00 psychological level first, with...
COINBASE:BTCUSD We're currently at a significant support level after breaking below the ascending trendline and a descending triangle pattern. This is truly a make-or-break moment for Bitcoin in the short term. Price has broken below the multi-month uptrend line Descending triangle pattern broken to the downside Currently testing horizontal support No major...
Price has reached a critical support zone - Looking for strong rejection or breakdown. Bollinger Band Contraction Bands (purple lines) showing significant narrowing Price consolidating near the lower band Squeeze pattern suggesting imminent volatility expansion TTM above zero line VFI (Volume flow indicator by Markos Katsanos) (not shown on chart) Crossing...
Bitcoin is showing promising signs on the weekly chart. The long-term uptrend remains intact, as evidenced by the series of higher lows and highs from the $15,460 low to current levels above $65,000. A key development to watch is the RSI indicator, which is on the verge of crossing above its 21-period EMA. This potential crossover on a weekly timeframe is a...
TTM Squeeze Overlay shows Bollinger Bands and Keltner Channels. When the Bollinger Bands (purple) go inside of the Keltner Channel (yellow), the market is said to be in a squeeze. The dots across the zero line of the TTM Squeeze & Momentum indicator will turn red, signifying this period market compression. Once the Bollinger Bands move outside of the Keltner...
Last summer NASDAQ:HUT saw a similar squeeze. TTM Squeeze Overlay shows Bollinger Bands and Keltner Channels. When the Bollinger Bands (purple) go inside of the Keltner Channel (yellow), the market is said to be in a squeeze. The squeeze is about to fire long, don't miss the trade! The dots across the zero line of the TTM Squeeze & Momentum indicator...
Hitting the Anchored VWAP from the bottom in Jan 24. Think we will see support here at 62k and push back up to 66k before running into some resistance again.
After a rather steep correction to a bit below 0.618 fib. Bottom looks to be in. First target around 15.3 - approx 40% increase from current level. Small goldencross incoming and break of the declining trendline. COINBASE:TIAUSD
I think we are seeing an opportunity for entry around the 200 Ema for the big Crypto's BTC, ETH, SOL. This is the flush, an ideal time to hop in and buy, since these areas are generally where markets will bounce back higher. Don't panic and buy before the next leg up.
Waiting for break of the skewed neckline. 1st target around 60k - fib 0.382 retracement - trendline 2nd target around 52k - fib 0.618 retracement - POC
A move down to 25,400 was a perfect opportunity for buyers as we can see BTC have printed a Bullish Doji candle. BTC hit the lower band, which has shown that it is time to scoop up the sats. Bitcoin also landed perfectly on the vwap from the corona bottom and also the 200 weekly moving average. We also see divergence on the volume indicator which could...
Let's look at the numbers first: Fib 0.61 32.366 vwap 35.682 upper vwap 45.185 We are nearing the longterm trendline. Bollinger Bands are within Keltner Channel, which can tell that the market are preparing itself for an explosive move (up or down) - the key is to be objective and follow the signals - no hopium. For entering: - waiting till the...
On the three our chart we can see a Falling Wedge. Wait for breakout and buy or buy retest of the wedge before continueing up to next resistance at around 62.5K if wedge fails we will possibly visit 53.7K
Short term (rest of the year) Cloudflare will be in a correction (profit booking) like the rest of the market, which has been driven up crazy since the march dip 2020. Cloudflare will find support at 0.786 Fibonacci around 130-140$ which will be a good entry point for the start of next year 2021.
Very Symmetrical to the last triple top and looks very likely to follow same pattern and test the support at 51000 lower channel support line, support line and fibonacci 0.38 before continuing back up to test 64000


