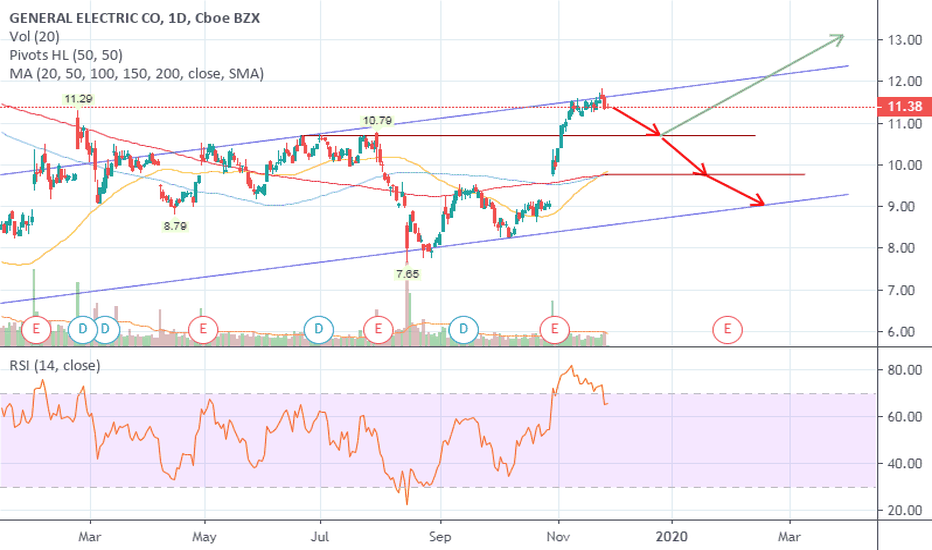
Cart Speak for itself. we are most like in an overbought condition with a fear and greed index above 75 for last month. we can traceback some and test previous supported area
1) test support $10.3-$10.5 area, if it fails to support it will go further down to test moving average or gap + channel bottom. 2) it can also bounce from $10.3/5 area and test the current area or probably o higher and test a $13.75 resistance area.
The chart speaks for itself MCHI is one of ETF for shcomp NASDAQ:MCHI
Looks like it is almost finished with the accumulation period and getting out of it. We have been accumulating for almost 6-7 months. And it seems like now it's time to fly. It making higher lows under resistance, and consistently making attempts to break 200 MA.
Distribution at UT And Test and now entering into the Phase C


