GWAV shorts about to start covering!! PUMP IT!!100 million shorts to cover.
We could see this pump beyond $0.20
4 Hour MACD about to flip bullish!
Not financial advice!!!

Support ZoneThe support we have reached now is a multiple one:
1. The April close and low,
2. The 38% retracement of the large rise from October 2022 till March 2024,
3. The December 2023 trading range.
There is still downward momentum but the chances of a good gain are sufficient to take a position. If the decline will continue however an increase of the position at better prices is possible.
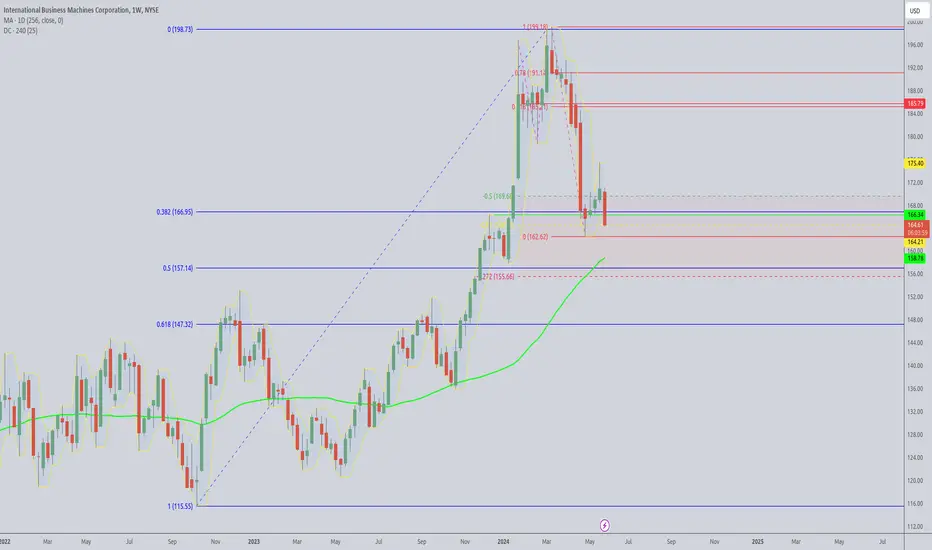
Falling HighsThe trend is up and seems unbroken strong. But I notice the falling highs since the top in December. The December high could not be reached again and a another downward correction is likely even if the correction will result in a sideward range for a longer time.

3M Pulls Back3M is emerging as a potential turnaround story following years of downside. Now trend followers may take interest in its latest pullback.
The first pattern on today’s chart is the trio of high-volume bullish candles since early March. MMM raised guidance, spun off its Solventum NYSE:SOLV health-care division and then ended with a consensus-beating quarterly report.
The result has been a succession of higher lows and higher highs. Is a new uptrend emerging?
Next is the July 2023 high of $94.59. Prices stalled at this level in early April and bounced above it on May 8. The 50-day simple moving average is in roughly the same place. If prices remain above those spots, it may suggest a more significant turn has occurred.
Finally, stochastics have dipped toward oversold territory.
TradeStation has, for decades, advanced the trading industry, providing access to stocks, options and futures. See our Overview for more.
Past performance, whether actual or indicated by historical tests of strategies, is no guarantee of future performance or success. There is a possibility that you may sustain a loss equal to or greater than your entire investment regardless of which asset class you trade (equities, options or futures); therefore, you should not invest or risk money that you cannot afford to lose. Online trading is not suitable for all investors. View the document titled Characteristics and Risks of Standardized Options at www.TradeStation.com . Before trading any asset class, customers must read the relevant risk disclosure statements on www.TradeStation.com . System access and trade placement and execution may be delayed or fail due to market volatility and volume, quote delays, system and software errors, Internet traffic, outages and other factors.
Securities and futures trading is offered to self-directed customers by TradeStation Securities, Inc., a broker-dealer registered with the Securities and Exchange Commission and a futures commission merchant licensed with the Commodity Futures Trading Commission). TradeStation Securities is a member of the Financial Industry Regulatory Authority, the National Futures Association, and a number of exchanges.
TradeStation Securities, Inc. and TradeStation Technologies, Inc. are each wholly owned subsidiaries of TradeStation Group, Inc., both operating, and providing products and services, under the TradeStation brand and trademark. When applying for, or purchasing, accounts, subscriptions, products and services, it is important that you know which company you will be dealing with. Visit www.TradeStation.com for further important information explaining what this means.

Nvidia Takeoff!! $1039 with earnings around the cornerNvidia earnings around the corner are we going to make another ATH in Spy! Will Nvidia get us there, I think so GPU 50 series release Rumors more Cloud Technology added in GPU's!! What else could you ask for in an AI boom!! $1039 price target for Nvidia

bottom-fish SGMOAs of May 22, 2024, Sangamo Therapeutics has 405 employees. The company focuses on research and development of genomic therapies and develops medicines for patients with genetic diseases.

Carvana- Low Risk/High Reward EntryIt's a rare occasion when fundamentals and technicals align, and we might just have a compelling case here. Carvana stands out as one of the most heavily shorted stocks in the market. The company has been in the red for quite some time, and this quarter was no exception, with a loss of $1 per share, falling short of analysts' expectations on both EPS and revenue (they lost more than expected).
Despite these challenges, the company sees a shift in demand, with buyers increasingly returning to online car purchases. The Orange number 1 on chart marks the lowest price at the open on the gap-up day ( $66.48), a +26% jump from the previous night's close. The momentum didn't stop there; the price ran another 20% to hit a daily high of $76, before settling at $69.21.
Here's my strategy:
- Stop: Sell if the price drops below $66.48 (allow some leeway, given the volatility)
- Target: If it trades above $76, we could be looking at an elevator ride up to $150, mirroring its previous ride down from $150 to under $30 a share.
I'm eyeing a 1:2 quick trade risk/reward ratio, but that's a waste and the prospect of a potential short squeeze is tantalizing (yes, I said it!). Opportunities like this are few and far between.
Trade carefully,
OnlyTrade2Win.

PayPal (PYPL) POTENTIAL LONG OPPORTUNITYWhat's going on everyone! Hope you guys had an amazing weekend! Wanted to get on here and post a potential bounce swing opportunity I see here on PayPal stock. So let's not waste any time and let's dive right on!
OK so when looking at the weekly chart you can see prices are edging to the upside. Making slight higher lows and higher highs and overall you can see that PayPal is a strong company and overall at a good price. On the daily timeframe you can see price is currently in am uptrend since October of 2023. Prices have been falling but they are coming down into a significant area of demand on the daily and weekly timeframe around 57-60 per share price average.
SO with all this being said watch for a bounce play on PayPal. I have 2 upside areas I see price coming into. Since it is sitting below the daily 200 EMA I am not aiming for the stars on this at this time so expecting this to be a for sure bounce play right now based on historical demand for this stock..
So keep an eye out this week watch prices as they come down! Hope this post added some value to you guys!
Please boost this post and follow my page for more accurate analysis! Cheers!

TSHA - long - catalyst playTaysha Gene Therapies Inc is a patient-centric gene therapy company to eradicate monogenic CNS disease. It is focused on developing and commercializing AAV-based gene therapies for the treatment of monogenic diseases of the CNS in both rare and large patient populations. The company develops and commercializes transformative gene therapy treatments. It is advancing a deep and sustainable product portfolio of 18 gene therapy product candidates, with exclusive options to acquire four additional development programs. Its product candidates include TSHA-101, TSHA-118, TSHA-102, TSHA-103, and TSHA-104
This is not a financial advice!
Upcoming catalyst on 31st. of March
We need to stay in a bullish overal sentiment of the market. If we see a corretion, this play might doesn't work.
13% short float
Rel. Vol. at 3.13
Block buys and Passive Stakes
Keep an eye on 2.0, 2.50, 3.0, 3.9 and 5.0 level, needs to get broken for a further upmove. You can take partial profits at these levels if u want to lock in gains.
SL under 1.10
TP approx. 5.0
Most info on the chart.
Trade carefully!

AAP Good situation to buy!!! Not Investing Advice!!!1) I applied WMA(14 period) on CCI indicator and it gave us to buy sign before 2 months ago.
2) I applied SMA(8 period) on Momentum indicator but it have not cross yet. They are very close each other. It is close to break its resistance level.
3) RSI indicator is going approximately 25-30 level for monthly period. Also it broke its resistance line. 25-30 level is meaning that security has been sold a lot. It can be good opportunity to buy in this area but it is not working very good when security has strong trend. RSI's 2 moving average did not cross each other and it is sign to us for waiting.
4) MACD has light red bars as you see on the screen and please check out all arrows on the screen. In my opinion they will cross each other soon. Light red bars are giving this message to us Down Trend is decreasing and Upper Trend can show itself.
5) We have no any divergence on indicators.
6) DMI indicator has 3 moving average and Red one represents ADX. Orange one represents -DI. Blue one represent +DI. If Blue cuts above Orange line it is buy sign but they are away from each other. On the other hand if ADX cuts above -DI it is buy sign and they are going each other.
7) I applied DEMA on prices and their period Orange one is 5 period and Red one is 20 period. We have not got any buy sign from there.

ENPH Weekly/Monthly Analysis!1)I applied 2 moving averages on prices which have 5 period(red one) 20 period(green one) have cut each other and we got buy sign this week because we had to wait at the end of this week's closing candlestick on prices.
2) Also i have drawn resistance lines on prices and they have been broken this week with green candlestick. This is another buy sign.
3) RSI indicator has broken its resistance line this week and it will increase soon in my opinion. Also its 2 moving averages which are purple and green have cut each other.
4) Momentum has broken its resistance line this week. Also i applied SMA(8 period) on Momentum indicator. Momentum cut above its moving average and it is another buy sign.
5) MACD lost its strong down trend power as you saw. As i showed you on indicator, red bars are going sideways not going down showed us maybe reversal trend can occur.

We will wait to June or July for SEDG!!!1) I drew Resistance line on RSI Indicator.
2) I drew Resistance line on Momentum Indicator.
3) I drew Resistance line on CCI Indicator.
4) I drew Resistance line on MACD Indicator.

AMSC Computer medium cap beats earnings LONGAMSC on the daily chart has went 3X in 7-8 months on the strength of earnings beats and
the tailwinds of the AI supertrend. I see this as an excellent swing long trade to hold into
the next earnings in 3-4 months. AMSC is currently at its ATH and going higher means no
overhead resistance.

RDFN fintech small cap reverses higher LONGRDFN on the 15 minute chart has move up from a low pivot which included a mass index
indicator triggering. ATH was $85 so current price is 7-8% of that ATH. I will take a long trade
here. My targets are the May high pivot at $8 and the January high pivot at $10 with a stop
loss at $6 to be managed as the price moves toward 8. RDFN to a certain degree is subject to
rates and federal actions. I am convinced that when the time is ripe the Biden administration
will pressure the " independent" fed into a rate cut which should give RDFN the momentum it
needs to push toward those targets or even higher.

NVDA to 1300 in next breakout. I believe NVDA will be $2,000 in a flash. but that's larger time frame. For now let's focus on seeing it hit $1,300 first.
Not financial Advice. But Most people didn't notice my MSTR ideas when I was banging the table. It was $487 and I believed it would hit $800 first. then after i saw the strength to $1,300 and quick support it created above $1,000, I KNEW $2,000 was coming.
Same vibes here. NFA - thoughts only

Tesla to gain over summerI am a new trader so take this with a grain of salt... But i belive there is a large inverse head and shoulders that is ready to break out this summer on the weekly timeframe, i have uploaded my chart. I will be going long next week to the middle of july, this seems to be the pattern it follows every summer.

MSTR Can Double Your GainsMicrostrategy has been the foremost Bitcoin related stock outside of the miners or ETFs.
Ive noticed that MSTR tends to be significantly better correlated than some of the other BTC related plays, however you must be careful as it acts as a leverage play as BTC moves. You will generally see MSTR move 2x - 3x the percentage move of Bitcoin.
Looking through the chart, we can clearly see a bullish trend on the hourly time frame, however we may have potentially reached a physiological limit at $2k as price rallies before a sharp rejection.
I would be welcome to a nice pullback towards the lower level range around $1600 where MSTR left a large gap prior to pumping. This would be a strong buy zone if Bitcoin continues to rally to new all time highs.

bottom-fishing $INTCIntel, under CEO Pat Gelsinger, has actively competed with AMD, releasing more advanced chips and repositioning itself as a manufacturer. it still produces most of the chips it designs and has repurposed its production capabilities to serve as a manufacturer.
Artificial intelligence (AI) is expected to exponentially increase chip demand, also benefiting INTC.

May 31: More downside to correct Oct 2023 rallyNASDAQ:NVDA on weekly produced a bearish evening star candle, which coincides with bearish RSI divergence on the weekly and also 5 waves complete from Oct 2023.
More downside is expected, as seen in 1 hour chart where the first 3-wave (wxy) drop in the last week of May had RSI divergence which needs to be erased in a double correction.
Likely drop to at least retest the major psychological level of 1000.

AMR Fib. Expansion. Next Resistance Level 457.80$After pullback, security has lost its value approximately %20 but that was pullback. It has happened with gap in daily chart. 07 August 2023 Symmetrical Triangle resistance was broken and second pullback can occur 457.80$ level. At the end of this week, we have to close this security more than 340.65$ level and it will be our support line.

THE BATTLE IN THE CHANNELFirst of all I have to mention that what im going to write below is messed up,but you all will understand. My writing its not going to have any price analysis. Its going to flowing ideas about THE BATTLE IN THE CHANNEL.
The last few weeks we have seen a crazy volatility in the price action. We all have to agree with that this Battle is different than the others.
We expect crazy volatility.If you are lucky you can profit out of this.
I talk about GME. this volatility created THE CHANELL.
So, people jump in and expecting to profit out of this volatility.
I say,hold a second.
As i said you trade this volatility,you lucky,you make money.If you are not lucky,you no money no honey.
So after the break out of the 3.5 years FALLING WEDGE the price went BBRRRRRR,AND THEN BOOM 17.72$.
I bought one more time the dip. Volatility kicks away the loosers.
The price is in an uptrend chanell.
We call it THE CHANNEL.
10$ UP TREND CHANNEL.
I put out of conversation the parabolic movement to the 80$.
Back on THE CHANNEL again.
After of a few good news last week we saw the volume going down.But thats ok.
The price is at a good potision at the moment.
I feel that the price action after the break out its normal for the size of the money as at the size of the time on this HUGE falling wedge.
I believe that whoever reads this knows how a falling wedge works.
But this kind of approach to find out what the price is going to be in the future its very basic.
In this play THE BATTLE for the Bulls and the Bears is back again vol2 at this nice up trend CHANNEL.
Its goin to be very intresting in the month of June.
Lay back get your bananas and enjoy THE BATTLE. iTHINK BULLS HAVE THE UPPER HAND IN THIS ONE. LETS SEE...
Ofcource none of this above are financial advise. How can it be?
PS: If the MOASS theory comes true, then this play is going to have a long way up trend inside THE CHANNEL with the upside downs also.
Parabolic of course,eventually! NYSE:GME
Deffinetly Its going to be extravaganza style. NYSE:GME

Amazon JungleWas waiting to see if the blue curve holds in this project in order to decide to post these simulated projections that take into account potential pivot points, reversals, or zones for support/resistance and BREAKOUTS... in either direction, even though I am slightly bullish biased on this one.
I have this scenario in mind where this could find support somewhere at the white or continuing on the blue or towards the red for a more decisive push in case the Earnings don't upset the whole harmony in this picture.
If everything goes to pieces will be having an eye for the possibility of the blue curve becoming resistance with a retest.
Other lower probability scenarios are some impact zones around the green and purple rectangles. If the prices reaches the top curves it would be only as a reference to see the price action around them for potential validation of the simulation.

VRAX is under 1.00Came to my attention just under a dollar. Couple of days ago, gave a good buy signal with an Alpha candle. Today is a continuation. Check the stop loss area and adjust the position sizing accordingly.
