A rise in BTC = a run on MARAIf BTC continues a bullish course then I think we can expect to see MARA in very good standing. I have also identified a previous pattern worth noting. Conditions aren't identical but perhaps close enough to cause some excitement. Not financial advice, DYOR.

ZOOM LongZoom has been consolidating and forming a rounded bottom for a while. It is much cheaper now than before Covid and yet is a much stronger business so undervalued IMO. Either way, the chart looks like the downtrend is over and it has completed waves 1 and 2 of a new impulsive uptrend. Recent price action appears to have completed the retrace of wave 1 of 3, so we should expect a strong move up fairly soon; buying now means you avoid the agonising sideways chop long-term holders have had to deal with and still benefit from all the upside!

5-Year Opportunity to 20x Your Money in 400 Days?Novavax, Inc. (NVAX) has recently bounced off a 5-year support line, potentially paving the way for a bullish move that could yield a 2,000% profit. 🚀
- The RCI 3 line indicator shows a bullish crossing of the middle and long trend lines.
- The RSI spiked above the moving average.
- A rare bullish signal has appeared below the chart. The last time this happened was in December 2019, before a strong bull run.
If history repeats itself, a profit of 20 times your money in 400 days is possible.
What do you think?

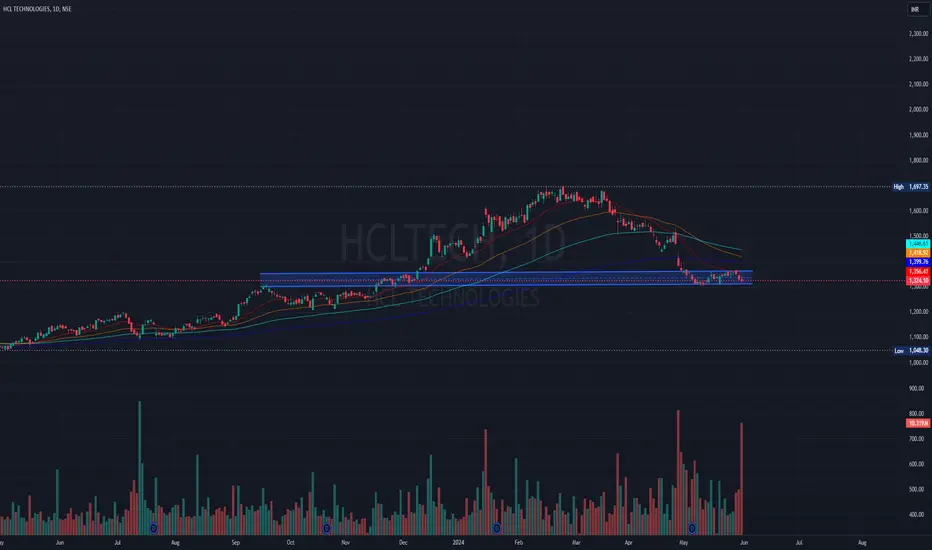
HCL TechHCL tech for long term, looking good at current level with strong financial performnace and high quality, the stock is consolidating from a long time.
it should not break 84.As mentioned in analysis shared on 19-05-2024 that
85 should be Sustained on Monthly Basis; we
can see that Monthly Closing is at 89.90
Clear Bullish Divergence may act as a Reversal sign.
Now it should touch 92 - 93 once & Sustain this Level for
Further Upside.
On the Flipside, it should not break 84.

a Look at NHPCStock is taking support at trendline
Its might for cup and handle pattern
buy now for target of 110 then could be 30 more target
or buy above 110 for 25% gain
This is strictly for eductional purpose
Market is ATH (trade accordingly)
Keep watch on market condition, if market falls no strategy works

NLST - Shake out before moving up again?Netlist ran on a good court settlement and then sold off. We came back and retested support, so now I can see us moving up again to the targets above. Not financial advice, DYOR.

PBR Back from Earnings DumpBrazil's largest oil producer just announced another huge dividend of 0.339. Ex-div June 12, payment Sep 26. That's 18.76%!
Price action is reversing off support of 14.96 and HMA crossed over bullish. We've seen this before back in March from another earnings dump and it recovered nicely.

Gamestop- Idiosynchratic Systemic RiskThe rise and fall of GameStop's stock in 2021 became a landmark event in financial history, captured in the recent film "Dumb Money." This saga, fueled by unprecedented social media buzz and retail investor sentiment, culminated in a historic short squeeze and raised critical questions about market access and regulatory oversight.
The Spark: A Sentiment-Driven Squeeze
GameStop, facing declining brick-and-mortar sales, became a target for short sellers who saw its business model as outdated. However, a surge of online optimism, primarily on platforms like Reddit and Twitter, ignited a buying frenzy among retail investors. This sentiment-driven buying pressure triggered a dramatic short squeeze, propelling the stock price to dizzying heights in January 2021.
The Fallout: Buy Buttons and Direct Registration
While the price eventually corrected, the social media fervor persisted. Concerns about trading restrictions implemented by certain brokers during the squeeze further fueled the fire. This led retail investors to embrace Direct Registration of Shares (DRS), a process that removes shares from the clutches of brokers and places them directly with the company. The goal: to limit the availability of shares for shorting and potentially trigger another squeeze.
DRS: A Unique Market Phenomenon
With over 74 million shares DRS'd as of the last earnings report, GameStop represents a unique case in market history. No other non-penny stock has witnessed such a large-scale withdrawal of shares from the open market by retail investors. This unprecedented scenario has created a volatile market dynamic with the potential for significant price movements.
Technical Analysis: Signs of a Potential Breakout
GameStop's price chart exhibits classic characteristics of a stock primed for a short squeeze breakout. Price consolidation since the 2021 squeeze, falling volume and volatility, and rising short interest are all potential indicators of pent-up pressure.
The Socioeconomic and Elliott Wave Perspective
Analyzing market movements through a socioeconomic and Elliott Wave lens, we recognize the crucial role of collective sentiment and mood in driving stock prices. GameStop's price trajectory aligns with a clear 5-wave Elliott Wave pattern, suggesting a potential return to all-time highs and beyond.
Potential for Government Intervention
The exponential counterparty risks associated with a potential GameStop squeeze raise concerns about systemic market instability. Government intervention, in some form, cannot be ruled out to mitigate the potential fallout of unrecoverable margin calls on significant market players.
The Sequel Awaits: A Story Unfolding
As time unfolds, the GameStop saga continues to evolve, captivating both financial experts and retail investors alike. Whether a sequel to the "Dumb Money" film materializes remains to be seen, but one thing is certain: the story of GameStop is far from over, with its potential consequences for the market attracting keen attention worldwide

NBCC Long Term Outlook.Picture Perfect Weekly and Monthly Closing. India on the cusps of Making History again as stable govt. is about to get re-elected for a third consecutive term. I am expecting a 4-5 times kind of return from the current date i.e. 01.06.2024. Time frame should be 3 Years. See you all in 2028.

Tmgh Important LevelsHello Dear Traders,
Tmgh Important Levels on the chart (Jinny Gann square of 9 levels)
Treat it as Support/Resistance .
Main Up Trend-Line (Yellow Trend)
Current Support 51.27 - 51.0
was Pivot/Resistance : 57
Down-Trend Channel Plotted on The chart.
Cci levels -198 Indicating over Sold levels.
Rsi is 39 Near Support "Near over sold" Usually around 30
Table in the Bottom left corner has some important Data .
Wish you Best of luck Trading.

TSLA Descending Triangle Chart Pattern and Monthly Analysis!1) I applied 2 moving averages which have 5 period(red one) and 20 period(green one). Red one cut below orange one it is sell sign.
2) Descending triangle occurred here and previous support line was broken. On the other hand, Pullback has happened but it could not reach above of this support line. Descending triangle is generally reversal pattern in technical analysis.

COINBASE - #COIN massive Inverse Head & ShouldersTwo targets
Linear and Log projections
Both are juicy obviously
Brian Armstrong timed their IPO perfectly and extracted billions of dollars kudos to them
Wouldn't it be something if Coinbase was to return back it's #IPO price this coming bull , seems like destiny

Currently Near Resistance around 459 - 465.Currently Near Resistance around 459 - 465.
For Fresh Entry, one should wait for 480 to
Cross & sustain.
On the flip side, 427 - 430 may act as an
Important Support.

EMAMI LTDLooks Good on Monthly Time frame,
Volumes are good,
Price action looks Good on weekly Time frame as well.

Visa are double topping?A double top is forming in a decending order ( a lower high)
Coming according with spx500.
Next few days are critical, be advised of this resistance level


SMCI trendline retest bounce go LongSMCI broke above the trendline, then retracted back to re-test the trendline and this time it bounced off of the trendline, rejecting the trend continuation and going into reversal. Go Long.

Is a buying opportunity coming?With resistance at 820 is respecting the pinball forecast, with last week’s candle structure indicating a pullback is possible. While it is possible for the current wave structure to push higher, the RSI divergence supports otherwise. While any pullback would need evaluation, it may lead to a great buying opportunity.

Bottom in for Humana? If so, that's a nice dip! Humana Inc. (HUM) recently experienced a significant drop of about 40%, landing on a 10-year support line. Is this the end of the decline for Humana? If so, this could present a very good buying opportunity.
- The RCI 3 line indicator shows a triple bottom.
- The RSI was oversold, reaching around 18, and has crossed above the moving average.
- The chart displays a rare buying signal, last seen in May 2019.
If the price recovers, a profit of 50% is possible. What do you think?

Boeing going down!Boeing failed more than one third of the FAA audits for the MAX, the failures are systemic and the entire board and senior management team needs to be replaced. Add a launch failure and this stock will be toast Monday morning. My prediction is it opens around $165, drop to $142 and it may find some support. This could go as low as $121.

RIO update in H1 chartHello
We have discussed about this instrument in the last publish and I just want to give you some ideas about its waves counting.
The important point is that it corrective patten has become more reliable and we can expect a rally after this correction.
It might be waiting for BTC movement.
Thanks

Is Affirm Ready For a Breakout?Outlook - Consolidating around 28/29 with the stoch approaching a solid bounce
zones. Decent headlines lead me to believe a nice run can happen.
Upside Targets:
* 30.78--31.86--33.06--34.63
Downside Targets:
* 28.82--28.37--27.07--24.48
Daily Trend Tracker -
*DXY+ *VIX- *US10Y-
