Forex market

USDCHF Buy LimitUSDCHF Daily Buy Limit
Technical Analysis:
Taking The End Of A H4 Correction
Mainly Based On The Tool ( Trend Based Fibonacci )

GBPUSD sell setuphey guys here's what i am looking at on GU, i am expecting a dowmside movement on GU, with the dollar being stronger the the pound i am expecting the pound to drop futher to the downside with price currently at a support level and with the fib as another confluence, i will be selling the pound against the dollar.
if this helps kindly share your thought and support, thank you.

GBPUSD LONGStill going with the trend, last week I was wicked out of a position, Looking for a pullback to go long
Market Structure is Bullish on HTF
Entry is at Daily AOi
Weekly Rejection from AOi
Daily Rejection at AOi
Around Psychological Level 1.27000
H4 Rejection at AOi
Levels 1:6.01
Entry 75%
REMEMBER: Trading is a Game Of Probability
: Manage Your Risk
: Be Patient
: Every Moment Is Unique
: Rinse, Wash, Repeat!
: Stay Hydrated
#Follow#Share#Comment#Boost
There is a high probability of price going Higher and breaking the Resistance, I will look at taking advantage if that opportunity arises

Bullish movementEURUSD showing signs of possible upward movement with a good risk to reward ratio of 1:4.

EURUSD Jun. 01, 2024All currencies appearing in this post are fictitious.
Any resemblance to real currencies, existing or dead, is purely coincidental.

GBPJPY 197.00 incomingI think gbpjpy is about to pivot and we will soon see 197.000 on the M30 timeframe presents a potential shorting opportunity due to a recent breakout from a wedge pattern.

Scenario for a Long Correction in EUR/USDIt appears as depicted in the chart,
the daily closing price halted precisely at the trend-line.
This suggests that the price is likely to go downward
before resuming its bullish trend.
This differs from my analysis in a post a few days ago.
In that post, I speculated that the appearance of a bearish leading diagonal
would mark wave 1 of a downward trend,
but it seems it may only be wave A of a correction,
or perhaps just a double three correction.
Another reason why I calculate this correction as wxyx (indicating there will be one more downward swing)
rather than abc (suggesting the price will go straight up)
is the form of the recent two-day upward movement
that formed a perfect zigzag (wave x) as we can see in the lower time frame,
followed by a downward impulse (wave a of z).
nb: this z would take form as a corrective wave (abc) and not a full impulse
However, it's worth remembering that the two strong impulses last Friday
could potentially be waves 1, 2, and 3, continuing the bullish trend.
I've included an invalidation level for those who aggressively take a sell position.
In my opinion, the best approach is to wait for the price to break below Thursday's low,
await a reversal pattern as confirmation,
and then take a buy position.
It would be nice if the price rebounds according to Fibonacci ratios as shown in the chart.
the trend-line would also help us to know the reversal.
It sounds like you're eager to take profit!
Patience is key in trading,
but when the opportunity arises, seize it with confidence.
how about you?
Happy trading!

EURUSD Massive Short! SELL!
My dear subscribers,
EURUSD looks like it will make a good move, and here are the details:
The market is trading on 1.0847 pivot level.
Bias - Bearish
Technical Indicators: Both Super Trend & Pivot HL indicate a highly probable Bearish continuation.
Target - 1.0828
About Used Indicators:
The average true range ATR plays an important role in 'Supertrend' as the indicator uses ATR to calculate its value. The ATR indicator signals the degree of price volatility.
———————————
WISH YOU ALL LUCK

"AUDCAD Analysis: Engulfing Pattern and Potential Trend Reversa"💹 Let's dive into the analysis of this favorite forex pair of mine! We'll update our previous analysis and check our triggers together for the upcoming week.
⏳ Higher Time Frame Analysis:
In higher time frames like the weekly, similar to most forex pairs, AUD/CAD is oscillating within a long-term box. We observe the fluctuations and trends more clearly in lower time frames.
📅 Daily Time Frame Insights:
On the daily time frame, after finding support at the 0.85918 level, we have reached the top of the box. The candles are erratic, with shadows indicating weakening buyers and potential sellers' presence.
🔍 In our previous analysis, we aimed to open positions in the direction of the ongoing trend, waiting for the trigger and break of the 0.90549 resistance. After breaking it, lower time frames allowed for position openings, reaching the 0.91245 resistance.
💡 After hitting this resistance, buyers showed little interest in opening positions, and currently, the pair is oscillating between the 0.90878 and 0.90549 box.
⏳ Four-Hour Time Frame Analysis:
In the 4-hour time frame, the latest candle displayed significant seller strength, engulfing the previous candles and increasing the likelihood of a decline. If we break the 0.90549 support, we will have formed a lower high and broken a lower low.
📉 Short Position Trigger:
We need to break the 0.90549 support for a short position. This will indicate a new trend, though we don't necessarily need a trend change since the higher time frames are still ranging.
If you receive this analysis early, you can use the current 4-hour engulfing candle with a stop loss around the 0.90878 level.
📈 Long Position Trigger:
For a long position, if we fake out the support, we can move to lower time frames. Breaking the 0.90878 trigger can open a long position, but it is more logical to wait for a break of 0.91245 for confirmation.
🛡️ Future Additions:
Soon, we will add a new section to this channel about bullish crypto coins. We will analyze and review this data thoroughly for you! :)))
🔻 Key Support Levels:
0.90173 , 0.89702 , 0.88951
🔺 Key Resistance Levels:
0.91245 , 0.92073 , 0.93288
🌟 I hope you have a great weekend and can utilize this analysis for a profitable week ahead! :))

USDCADUSDCAD.
I marked the previous year and high, Price will always retrace back to the open/close. If you mark the previous high and go to the weekly time frame, marking that open and close that formed the previous weekly high, you can see that price retrace above open/close and drops from there. Thats a bearish scenario. Same thing happened this year, price created the current year high and retraced above open/close, thats second bearish scenario. I expected price do the same thing this month, to retrace above the open close on that daily candle that created the current monthly high. Once price retraced above e left a rejection + OB, I left a sell limit for price to retrace back mitigate that zone and drop.

EUR/CHF - 2 Day Chart AnalysisWe can see the clear change of trend on the 2 day time frame for EUR/CHF after finding a base at the end of last year. Last week saw price pulling back towards the trendline, meaning that we could start to see buyers creeping in sometime in this new trading week. Keep an eye on the smaller time frames for clues.

EURNZD Potential DownsidesHey Traders, in today's trading session we are monitoring EURNZD for a selling opportunity around 1.76900 zone, EURNZD is trading in a downtrend and currently is in a correction phase in which it is approaching the trend at 1.76900 support and resistance area.
Trade safe, Joe.

EURUSD continues to target 1.1000Dear traders! On the demand timeframe we see EURUSD trading on an uptrend basis after it previously broke out of downtrend resistance. The technical outlook is optimistic and the Uptrend will certainly be supported by buyers higher and we would expect a local price increase targeting the medium to long term near the 1.1000 mark.

Gbpusd shortGbpusd has been in a bullish streak for the last 2 weeks, it recently broke the bullish channel and came back to retest, creating bearish flag now we are going short on that retest

GBPUSDcheck the charts , gbp traded into the fair value gap, need to further check the reaction of the candles

AUD/USD - H4 Chart AnalysisThe H4 chart for AUD/USD shows a potential range in play between the 0.6670 and 0.6600 price points. The penultimate candle of the final session showed a big rejection of the top of the zone. We may see price continue lower in this new week to test the lower part of the range.

EURUSD downtrend continuesDear traders! EURUSD continues to remain within a medium to long-term downtrend channel despite some mild recovery yesterday, but overall still unable to overcome 1.0850 resistance amid shifting sentiment from That pulled the EU down sharply to near the 1.0800 support level as of now. Accordingly, Resistance at 1.0850 continues to hold prices amid correction and sell-off. I expect that after a recovery and testing the liquidity of the market, the price will decrease. This decrease is expected to reach 1.0790 and 1.0755 at least.

AUDUSD SELL1HNext Week
Targets:
0.66269
0.65955
0.65696
0.65221
0.64820
Remember there is no 100% in financial markets

113.273 AS A BUY BUY PRICE OFFER!!!!The Second quarter of the year is over! What’s that summary of price action so far?
Well… price remained bullish. JPY keep weakening.
In all, if price is offered at 113.273, a buy opportunity is expected to occur .
Keep a close watch

USDCAD Bullish Trading IdeaDisclaimer, these ideas are for my records of what I see in the market after taking a trade. It will help me document the reason of why I took the trade so I can have a track record. And as such, this is not a financial advice.
I've noticed that at the monthly timeframe the pair is doing a wyckoff distribution schematic.
Then at the weekly timeframe, the pair once more is doing a wyckoff distribution schematic.
At the daily timeframe, I've identified a potential area of interest delimited by the fibonacci levels 1, 0.5, and 0 (orange lines). I believe the price is trying to reach that area of interest to get right of the liquidity delimited with the lines that have the $$$ above them.
At the 4 hour timeframe, the price appears to want to go higher, potentially giving strenght to my trade idea.
Given these findings, I'll be entering a buy position until it reaches the fibonacci levels, then I'll start looking for sells.

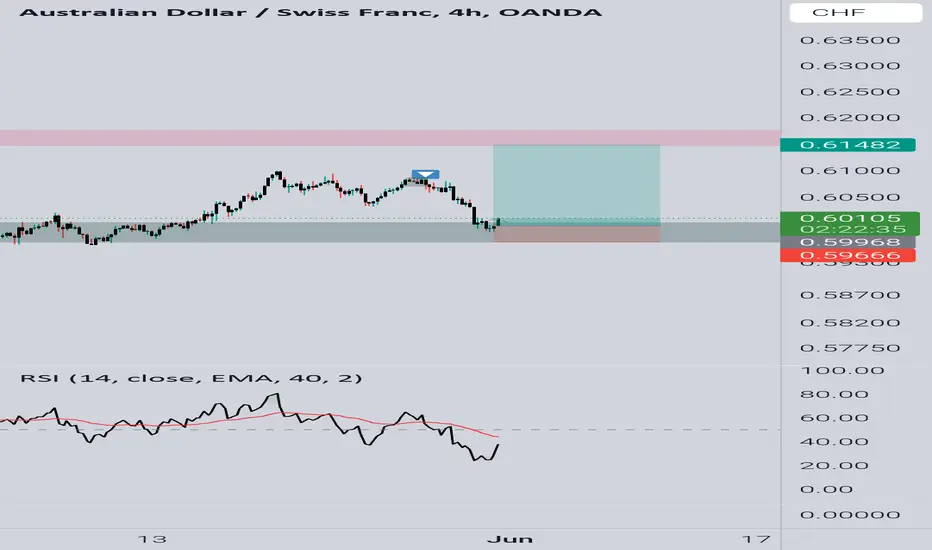
AUDCHF BUY Based on Daily and Weekly TF, the market is overall bullish. The market is currently reacting to a major resistance structure.
The 4HR TF is showing a reversal chart pattern, plus the the RSI is forming a divergence. We could possibly see buyers coming in.
Let's see how this will play out.
Feel free to share your views
EUR/NZD SHORT FROM RESISTANCEHello Traders
In This Chart EURNZD 4 HOURLY Forex Forecast By FOREX PLANET
today EURNZD analysis 👆
🟢This Chart includes EURNZD market update)
🟢What is The Next Opportunity on EURNZD Market
🟢how to Enter to the Valid Entry With Assurance Profit
This CHART is For Trader's that Want to Improve Their Technical Analysis Skills and Their Trading By Understanding How To Analyze The Market Using Multiple Timeframes and Understanding The Bigger Picture on the Charts
