Tesla - Going towards for a larger fall - 3 falling peaksShort if the price break through 196.12.
Target price around 110.
Set a stop price around 206.

Did you capitalize on the recent short?Second head of the double top has completely formed with a massive sell of to 258
myself, i shorted with a decending stop loss and i managed to capitalize not far from 258 and closed my trade at 261.2
Neck line is a proven support, as shown on the chart but things does not look positive for visa for now.
especially the closer we get to a correction at nvidia microsoft and s&p
4 hour chart moving avgs are posting a death cross
also 4 hourly is below the 200 ema.
IF we move further below from 268 at the daily candle close there is a very high probability of a bearish trend.
trade with caution

Trading Signal for IBM - SellDirection: Sell
Enter Price: 165.56
Take Profit: 166.83
Stop Loss: 164.33
Based on our analysis and projections using the EASY Quantum Ai strategy, we are recommending a Sell position for IBM. Below is a justification for this forecast:
1. Trend Analysis: Recent trends have shown consistent lower highs and lower lows, indicating a bearish market sentiment. This aligns with our Sell direction.
2. Technical Indicators:
- RSI (Relative Strength Index): The RSI is currently in the overbought territory, suggesting a potential price pullback.
- Moving Averages: The short-term moving averages have crossed below the long-term moving averages, confirming a downward trend.
3. Support and Resistance Levels:
- The Enter Price of 165.56 is strategically chosen based on recently observed resistance levels. Entering at this price anticipates a rebound from this level to lower prices.
- The Take Profit level of 166.83 is set above a significant resistance zone to maximize potential profits if the price temporarily moves upward.
- The Stop Loss has been placed at 164.33, just below a critical support level to minimize potential losses should the market move against our prediction.
4. Market Sentiment: Analysis of market volume and news sentiment suggests bearish pressure, reinforcing the Sell signal.
By following the EASY Quantum Ai strategy, we combine multiple indicators and market factors to provide a comprehensive trading signal. This strategy has been backtested to ensure optimal performance and risk management in volatile market conditions.
We advise adhering strictly to the specified Entry Price, Take Profit, and Stop Loss levels for effective risk management and optimal trading performance.

Seeking for Opportunities in Advancing MomentumIn seeking opportunities in the prevalent momentum in the utility sector, I will consider going long on a breakout to the upside of the resistance level.

Seeking for Opportunities in Advancing MomentumIn seeking opportunities in the prevalent momentum in the utility sector, I will consider going long on a breakout to the upside of the resistance level.

Oh.. Hey $RBLX NYSE:RBLX 6/7 Leader
Lately it seems that the rotations into small/mid cap stocks are underway, what gave this information away was when AMEX:IWM (holds small/mid-caps) started to outperform the rest of the market. This means that if money is picking up small/mid-caps then we want to position into the tickers that from a structure point of view are leaders, so we can catch a longer bounce when they start to outperform. NYSE:RBLX meets this criteria, not only is it outperforming some other arkk names but from a momentum point of view there is more room to the upside.
Some cons of this trade are the ITM strikes are call heavy, and there is a call wall at the $34 strike. So, any further continuation may be short lived.
The plan is to buy ITM $33 calls expiring 6/7. Entry is market open (wait to see if we set a new low within 15-45 mins) if a new low is created don't buy and wait to see if we eat up the sellers. If we have good strength when we open, then we can take the trade. Add another contract at market close, 1st TP is when your original contract is up 50-70%.

GAP Post Q1 2024 EarningsBeen following this one for the past couple earning sessions.Benefited from its recent report. Forward guidance looking strong and price action of course demostrated that witha 28%+ move. GAP is looking strong for the year post Q1 2024. Expecting a bullish continuation to retest that 35$ region that has acted as long-term resistance/support.

Tesla shows an upward bias, supported by two key indicators.Tesla is well supported by the ascending trendline and has closed at the 38.2% Fibonacci level. This current price presents an opportunity to add some shares to your portfolio. Alternatively, you may consider waiting for the price to drop around $160, given the signs of weakness in the Nasdaq.

HD update in H4 chart Hello
We have discussed about this trend and its opportunities in our last published idea and nothing is changed. I just want to give a complementary wave counting.
In addition, the best wave for trade in EW method is wave 3 of 3 specifically in bearish market. I do not know if this counting is true or not, but we can confirm it if it drops down.

TRIMBLE INC (TRMB) POTENTIAL LONG OPPORTUNITY What's up everybody! Hope you are having an amazing evening! Seriously a pleasure and blessing to be able to come on here and share with you all! YES...this is what I do with my Saturday evenings lol...wouldn't trade it for anything...no pun intended. But anyways aside from the bad jokes I wanted to come on here and make a post on a potential stock setup I am seeing on Trimble a tech company that is apart of the S&P 500 and share some insight on why I potentially seeing this next move being to the upside for this tech giant! So let's dive in!
OK so when looking at this chart you can see that a significant shift happened back in December of 2023 (last year). You can see prices were at a pivotal moment to either continuing the bearish trend creating lower highs and lower lows OR shifting to a demand driven (buyer) driven market which is what we ended up seeing! SO based on this and the fact that the momentum of the buyers were very strong when making the new high showing strong interest...I am looking for now a potential higher low to be formed (which is a technical trait of an upward or buyer trend) and then a continuation to the upside to further supply zones or even making new highs in this new daily demand driven market. Because now being in a bullish market we can expect a new HIGHER HIGH which is also a physical technical trait of a buyers market. They buy up price...demand exceeds supply...and drives prices of this companies stock higher!
ALSO you can see some technical confluence with the Fibonacci retracement indicator as well with our strong demand level adding confluence to our entry zone.
Hope this post provided some value to you guys! Please boost this post and follow my page for more accurate analysis! Cheers!

Can DELL shake a negative earnings report??Outlook - After a miss on earning report DELL has a tough road ahead. There is a huge
imbalance from 134-139 so I wouldn't be surprised to see prices pull back a little more
before looking for more upside. Also, POC did remain above the previous week.
Upside Targets:
* 145.02--150.421--53.25
Downside Targets:
* 134.02--129.20--124.57
Daily Trend Tracker -
*DXY+ *VIX- *US10Y-

TSLA GANN ProjectionsSince the peak, i've constructed a Gann square using time cycles derived from price, the 50 % of the all time high price level of 207 gets visited often during these cycles. A confluence of Gann angles on the squares and time cycles are pointing to the week of June 10th, 2024 as possibly retesting the 207 area in an attempt to make a first higher high on the weekly chart.

Could FUBO head to the MOON???Outlook - May load up on shares at this price. Weekly did shift lower even after 5
consecutive green days. 1.25 break and hold could spur more upside.
Upside Targets:
* 1.26--1.34--1.44
Downside Targets:
* 1.23--1.20--1.09
Daily Trend Tracker -
*DXY+ *VIX- *US10Y-

PayPal Is Planning an Ad Business Using Data on Its Millions of
## Growth
1. **Revenue Growth**
- PayPal's revenue grew by 10% on a currency-neutral basis in Q1 2024, with total payment volume surging 14% to $403.9 billion.
- However, the company expects a slower revenue growth rate of 6.5-7% for Q2 2024 on an FX-neutral basis.
- Analysts estimate PayPal's revenue growth for the full year 2024 to be around 7%, a significant slowdown from the 13% annual growth over the past 5 years.
- The consensus among analysts projects PayPal's revenue to grow at a 7.8% rate in 2025 and a median growth rate of 8% over the next 5 years.
2. **Total Payment Volume (TPV) Growth**
- PayPal reported a 13% increase in TPV in 2023, exceeding $1.5 trillion, indicating an expanding transaction volume and deeper user engagement.
3. **User Growth**
- While PayPal's user base declined in recent years due to increased competition, it still connects 426 million active accounts as of the analysis, benefiting from significant network effects.
## Profitability
1. **Margins**
- PayPal's operating margins improved by 84 basis points to 18.2% in Q1 2024 on an adjusted basis, addressing investor concerns about margin compression.
- However, the company's net profit margin deteriorated from 15.6% in 2020 to 8.8% in 2022, indicating a decline in profitability.
- PayPal's gross profit margin was around 40% on a trailing twelve-month basis as of the latest quarter.
2. **Profitability Ratios**
- Return on Equity (ROE) declined from 19.2% in 2020 to 11.9% in 2022, reflecting lower profitability.
- Return on Assets (ROA) also decreased from 5.9% in 2020 to 3.1% in 2022.
- PayPal's profitability score, which consolidates various profitability metrics, is rated at 60/100 by some analysts.
3. **Earnings Growth**
- Analysts expect PayPal's earnings per share (EPS) to decline by 0.6% in 2024 but rebound with a 10.5% growth rate in 2025.
- The consensus forecasts a 19.8% annual EPS growth rate for PayPal over the next 5 years.
## Solvency
1. **Debt Levels**
- PayPal's debt-to-equity ratio increased from 0.31 in 2020 to 0.53 in 2022, indicating a higher reliance on debt financing.
- The company's debt-to-assets ratio also rose from 0.14 in 2020 to 0.14 in 2022.
- However, PayPal's interest coverage ratio remained strong at 12.07 in 2022, suggesting it can comfortably service its debt obligations.
2. **Liquidity**
- PayPal's current ratio, a measure of liquidity, was around 1.3 as of the latest quarter, indicating a reasonable ability to meet short-term obligations.
- The company's quick ratio, which excludes inventories, was 0.29, suggesting a lower level of liquid assets.
3. **Solvency Score**
- Some analysts rate PayPal's solvency score at 60/100, consolidating various solvency metrics into a single score.
In summary, while PayPal's growth and profitability have slowed in recent years, the company still maintains a strong market position and network effects. However, its increasing debt levels and declining margins are areas of concern. Analysts expect a recovery in growth and profitability over the next few years, but the company's ability to execute its strategic initiatives and navigate the competitive landscape will be crucial for its long-term success.

Apple Rebounds with Strong Earnings and $110B BuybackApple and Nvidia have been dominating the market conversation lately. Apple's stock rebounded significantly after a rough start to the year, partly due to better-than-expected earnings and a massive $110 billion buyback announcement. Despite concerns about China and the iPhone cycle, the sentiment has turned positive. With WWDC and AI developments on the horizon, Apple’s outlook appears strong.

PAA Wedge PatternPlains All American Pipeline is forming a bullish wedge pattern. When this break out occurs (no later than June 21), expect a run to +19. With shares, that's not much of a gain, but with options this will be a huge pay off (+100-200%).
BUY Jan 17 17C 1.00

Using Fib Retracement as a Bullish Signal for Vistra StockUsing a very simple fib retracement indicator, there is potential for longs here for Vistra. It has been in a consistent uptrend, bouncing off fib support lines. Needs to break resistance line it tested at $108. I think it will soon. Next price target: $110

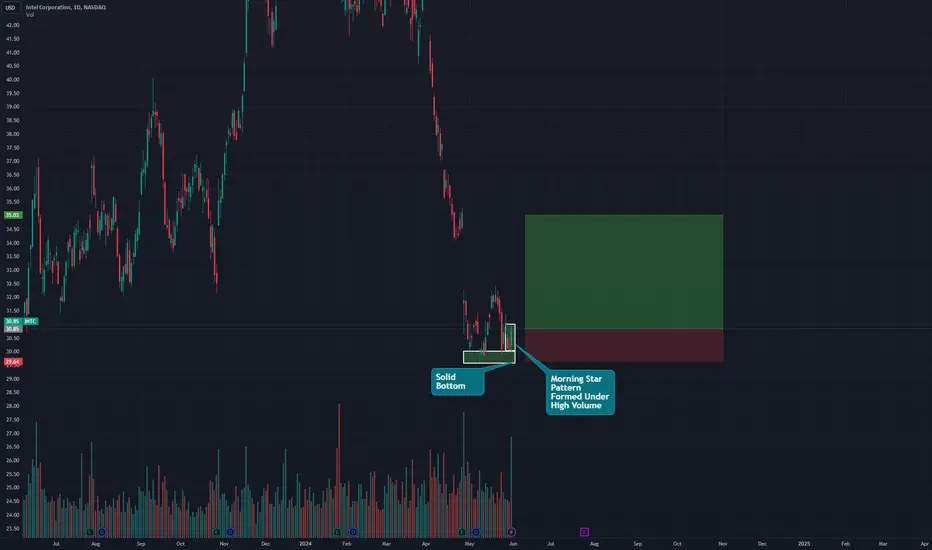
Intel Hits Bottom: Targeting the GapLet's not make it more complicated than it is. Intel seems to have found its bottom, and the gap is suitable as the first target for a long trade.
That's it!
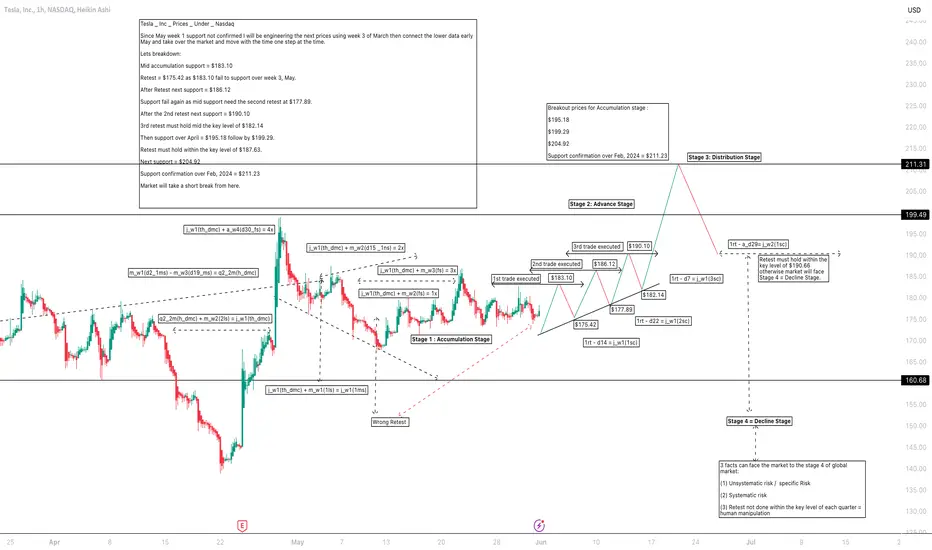
Tesla _ Inc _ Prices _ Under _ Nasdaq Tesla _ Inc _ Prices _ Under _ Nasdaq
Since May week 1 support not confirmed I will be engineering the next prices using week 3 of March then connect the lower data early May and take over the market and move with the time one step at the time.
Lets breakdown:
Mid accumulation support = $183.10
Retest = $175.42 as $183.10 fail to support over week 3, May.
After Retest next support = $186.12
Support fail again as mid support need the second retest at $177.89.
After the 2nd retest next support = $190.10
3rd retest must hold mid the key level of $182.14
Then support over April = $195.18 follow by $199.29.
Retest must hold within the key level of $187.63.
Next support = $204.92
Support confirmation over Feb, 2024 = $211.23
Market will take a short break from here.
$FSLR Long-term investment 🚀 Considering adding NASDAQ:FSLR to my long-term portfolio! With projected revenue and EBITDA growth of 20%+ over the next two years, this solar powerhouse looks set for a bright future.

AAPL Long $248 PTParallel channel + horizontal support/resistance pattern.
Similar look to price movement - initial channel is more exaggerated, but the general pattern of the price movement is the same.
Arrows denote price expansion after breaking out of the channels for the third time each.
$248 price target based on replicated price movement.
Apple fundamentals support this.
My article on Apple's buybacks, R&D, and stock price:
wire.insiderfinance.io

SOFI : Weak Down TrendIn the chart we can see that NASDAQ:SOFI
Weak Down Trend
Pattern : Falling Wedge
1. A falling wedge pattern is used to identify possible trend reversals.
2. It is considered a bullish pattern.
3. It signals that the selling momentum is slowing down.

Elon Musk Faces $7.5B Insider Trading Allegation From Tesla SharTesla ( NASDAQ:TSLA ) CEO Elon Musk has been accused of insider trading after selling shares worth over $7.5 billion in the last two months of 2022. The lawsuit, filed by shareholder Michael Perry in the Delaware Chancery Court, claims that Musk sold a total of over $7.5 billion worth of Tesla ( NASDAQ:TSLA ) shares in late 2022 before the disclosure of disappointing fourth-quarter production and delivery numbers. Perry alleges that Musk, using his access to real-time data, was aware of the lower-than-expected numbers when he sold shares worth $3.95 billion in November 2022 and $3.58 billion in December 2022. Tesla's stock ( NASDAQ:TSLA ) fell to $108.10 on January 3, down from the $123.18 it closed on December 30, and the lawsuit pegged Musk's "insider profits" for the aforementioned share sales at about $3 billion. The lawsuit also accuses then-Tesla directors of breach of fiduciary duty of loyalty for allowing Musk's sales and is seeking a directive from the court that all profits obtained from these share sales be returned.
The lawsuit is the latest of legal hurdles for the EV giant, as Musk's 2018 pay package, worth $56 billion at the time of award, was rescinded by a Delaware court earlier this year. Tesla's board is trying to have it reinstated by a shareholder vote again in June.
Tesla stock ( NASDAQ:TSLA ) closed Friday's trading session down 0.4% with a Relative Strength Index (RSI) of 52.21 which is moderate. Tesla is in a consolidation zone for the past 3 weeks.
