EURUSD: Intraday:Upon examining the updated chart for EUR/USD, it appears our previous analysis was profitable. Let's break down the current chart and provide an updated intraday analysis based on the new information provided.
Previous Day Analysis Review
In our previous analysis, we noted key support and resistance levels, the short-term upward channel, and the highlighted support zone. The suggested bullish scenario played out, as the price respected the lower boundary of the channel and moved upward, yielding profitable trades for those who followed the strategy.
The price is still moving within the upward channel marked in red.
The lower boundary of the channel remains around 1.08600, with the upper boundary near 1.08900.
Support and Resistance:
The highlighted support zone (purple) around 1.08550 - 1.08650 remains critical.
Near the lower boundary of the channel at 1.08600.
The upper boundary of the channel at 1.08900.
The price recently tested the upper boundary and pulled back, suggesting a potential retest of the support zone and the lower boundary of the channel.
A rebound from the support zone would align with the short-term bullish trend within the channel.
Trading Scenarios
Entry Point: Near the support zone at 1.08550 - 1.08650.
Target: The upper boundary of the channel that could around 1.08900 or more.
Stop-Loss: Below 1.08500, just under the support zone.
The intraday analysis confirms a profitable outcome from our previous analysis. The key levels to monitor include the support zone around 1.08550 - 1.08650 and the upper boundary of the channel at 1.08900. Maintaining a disciplined approach with proper risk management is crucial for successful trading.
Forex market

AUD/NZDBreak of structure in lower time frame , after BOS confirmation retest.
Pay attention to price action.........

CADCHFCADCHF Analysis .
Forms a bearish reversal Patterns Rising wedge , Double Top .
RSI divergence . Place sell stop at HL and SL at HH .
TP'S marked.

Possible short for EURAUDPossible HEAD and shoulders formation on the 1hr timeframe , also we got market structural shift showing a more bearish momentum to the. Downside

Possible long Trade for Eurchfincoming formation of Head and shoulders pattern and right shoulder align with fib 61.8 level, would like to see price reaction if price reaches to the red zone

HOW DID YOU DO THE ANALYSIS ON AUDJPY How did you ro the analysis on AUDJPYJPY
3 STEP
number one the fundamontal analysis
number two the technichala analysis
1-1 uptrend
1-2 determinie zone support and resistance
1-3 coreection dwon

USDCHF fundamental outlook LONG1. Fundamental Economic State:
United States:
GDP Growth: Slowing with recent figures showing an annualized growth rate of 1.1%.
Employment Data: Unemployment rate at 3.4%, indicating a tight labor market.
Inflation Rate: Moderating at 4.9%, following aggressive rate hikes by the Federal Reserve.
Retail Sales: Robust, supported by strong job growth and wage increases.
Trade Balance: Significant trade deficit influenced by high import levels.
Consumer Confidence: Improving due to a strong labor market and easing inflation.
Switzerland:
GDP Growth: Modest, reflecting the stability and high-income status of the economy.
Employment Data: Unemployment rate is low at around 2.2%, indicating near full employment.
Inflation Rate: Relatively low at 1.75%, which is typical for the Swiss economy.
Retail Sales: Steady, driven by high consumer confidence and purchasing power.
Trade Balance: Switzerland maintains a trade surplus, bolstered by high-value exports like pharmaceuticals and machinery.
Consumer Confidence: High, reflecting economic stability and robust labor market conditions.
2. Daily Percentage Changes:
Over the past month, USD/CHF has shown moderate variability:
May 27, 2024: The pair was trading at 0.9135, showing a slight decrease from the previous day.
May 10, 2024: The rate was around 0.905, impacted by US inflation data and Fed policy statements.
April 29, 2024: The rate hovered around 0.908, reflecting mixed economic data from both countries.
3. News Analysis:
Recent events impacting USD/CHF include:
Fed Interest Rate Decisions: The Fed's expected pause in rate hikes has moderated upward pressure on the USD.
Swiss National Bank (SNB) Policy: The SNB’s cautious approach to rate hikes supports the CHF.
Geopolitical Tensions: Global uncertainties have influenced risk sentiment, affecting both currencies.
4. Interest Rate Expectations:
Federal Reserve: Expected to pause further rate hikes after a series of increases.
Swiss National Bank: Likely to maintain a cautious stance on rate hikes given the low inflation environment.
5. Commodity Prices and Market Sentiment:
Market Sentiment: Risk sentiment has been fluctuating, with periods of risk aversion generally supporting the CHF as a safe-haven currency.
Commodity Prices: Not a major direct influence on USD/CHF, but broader economic impacts from commodity prices can affect market sentiment.
6. Projection Figures:
Based on current fundamentals and market conditions, the short-term target for USD/CHF is 0.9200, considering support from the Fed’s likely pause in rate hikes. Long-term projections are more uncertain, but a modest target could be around 0.9300, assuming continued economic resilience in the US and stable conditions in Switzerland.
7. Trade Ideas:
Short-Term: Go LONG on USD/CHF to a target of 0.9200, supported by potential stabilization in US economic data and the Fed’s rate policy.
Long-Term: Maintain a LONG position with a target of 0.9300, contingent on sustained economic growth in the US and a stable policy environment from the SNB.

Trading Signal For GBPCAD Trading Setup:
There is a Trading Signal to Sell in GBPCAD Forex Signal (1h)
Traders can open their Sell Trades NOW
⬇️Sell Now or Sell on 1.7439
⭕️SL@ 1.7481
🔵TP1@ 1.7322
🔵TP2@ 1.7186
🔵TP3@ 1.6936
What are these signals based on?
Classical Technical Analysis
Price Action Candlesticks Fibonacci
RSI, Moving Average , Ichimoku , Bollinger Bands
Risk Warning
Trading Forex, CFDs, Crypto, Futures, and Stocks involve a risk of loss. Please consider carefully if such trading is appropriate for you. Past performance is not indicative of future results.
If you liked our ideas, please support us with your likes 👍 and comments .

support n resistancelooking bullish on all timeframes. Already broke through key levels and now looking for new level to find some chill time.

Potential Bullish IdeaIt looks like the market is in a wave 4 (triangle) of the potential up trend with what looks like an impulse. Upon breaking the upper line of the potential triangle (correction), it will add more confluence to our plan. As it stands, we're looking for upward movement with this instrument. If one is to engage with it, make use of your trading tactics including RM, RRR and never forget your SL because, it will keep you longer in the market.

Long buddy!!!We are primed to rip 80-100 pips high for the rest of the week.
My confluences and entry trigger has been met 3 times for the long push
157.800 is my week target area
Trade safely my friends.

Lingrid | EURUSD LONG after Flag Pattern BREAKOUT The price perfectly fulfilled my last idea. It played out nicely; it hit the targeted level. FX:EURUSD has rebounded off the crucial psychological support level at 1.08000, and it appears to be forming a bullish flag pattern. A breakout of this pattern could lead to a further upward momentum. On the daily timeframe, we see a strong bullish candle, which shows the bullish sentiment. On the 4H timeframe, the trend remains bullish, and a breakout above the resistance level at 1.08600 could trigger a significant influx of buy orders. Meanwhile, the TVC:DXY has also bounced off the strong resistance zone at 105.00, an area that has been respected multiple times before. Overall, I anticipate a break above and close above the flag pattern, followed by a potential upward move if the price action continues to stay within its upward channel. My goal is the resistance at 1.09280
Traders, if you liked this idea or if you have your own opinion about it, write in the comments. I will be glad 👩💻

GBPUSD, Ready for sell IF ....Hello traders, hope you doing great.
for upcoming days, I think we'll probably see a downtrend in GBPUSD to specified Level IF the price stabilizes below 1.2734 . so we have to wait and see what will happen.
and finally tell me what do you think? UP or DOWN? leave your comment below .
if this post was helpful to you, please like and share with your friends.
Thanks.

NZD-CAD Will Keep Growing! Buy!
Hello,Traders!
NZD-CAD broke the key
Horizontal level of 0.8364
And the breakout is confirmed
Which reinforces our bullish
Bias and makes us expect
A further move up
Buy!
Like, comment and subscribe to help us grow!
Check out other forecasts below too!

EUR/GBP there, two different bearish formations were present. There was a bear flag as taken from a bullish channel that arrived after a test of the .8500 handle; and bigger picture, there was a descending triangle present with that .8500 level helping to set horizontal support.
The other side of the matter, however, was a relative dearth of volatility so far in 2024 trade as the pair had spent much of the year within an approximate 120 pip range. But, given the fundamental backdrop where the ECB seems closer to cuts than the BoE, there’s an argument for continued divergence between the two economies.
At this point the .8500 handle has come back into play and there’s potential for the descending triangle to fill-in.

✅NZD_CHF WILL KEEP GROWING|LONG🚀
✅NZD_CHF is trading in a
Strong uptrend and the pair
Broke the key horizontal
Level of 0.5600 and the
Breakout is confirmed so
We are bullish biased now
And we will be expecting
A further bullish continuation
LONG🚀
✅Like and subscribe to never miss a new idea!✅

✅EUR_GBP RISKY LONG🚀
✅EUR_GBP is going down now
But a strong support level is ahead at 0.8512
Thus I am expecting a rebound
And a move up towards the target at 0.8494
LONG🚀
✅Like and subscribe to never miss a new idea!✅

short!we broke the trend on the 4H timeframe and did almost a perfect retest on the trendline.
we are heading for lower lows.

USD/CAD SHORT from 1.3660USD/CAD has been declining since last week and shows not sign of finding support.
The Andean Oscillator on the H1 time frame turned BEARISH towards the end of last week and with no obvious levels of support we can expect to see the price of USD/CAD drift lower to 1.3588 area where BUYERS may well lie.
A look at the H4 time frame is revealing.
All 4 EMA's (25/50/100/200) are grouped together and the price is now below this group.
This means that USD/CAD BULLS would have to push through all these EMA's to head north and this seems unlikely in the absence of key drivers.
THe only news on the horizon comes at 15:00 tomorrow with the CB Consumer Confidence which is not generally a big move so if this print disappoints then we can expect to see USD/CAD decline at a faster rate.
The D1 time frame suggests we could be headed for the 200 EMA at 1.3570.
If this key level breaks then there's nothing to stop USD/CAD heading much lower but any significant CAD or USD news would set the agends for this pair.
With the Bank Holiday price action will be slow so I expect to see a gradual but steady decline with this pair.

DeGRAM | USDCHF decline on the breakoutUSDCHF is moving under an ascending channel.
The price broke through the trend lines and the lower boundary of the channel.
The chart dropped under the support level and broke the ascending structure.
We expect the decline to continue.
-------------------
Share your opinion in the comments and support the idea with like. Thanks for your support!

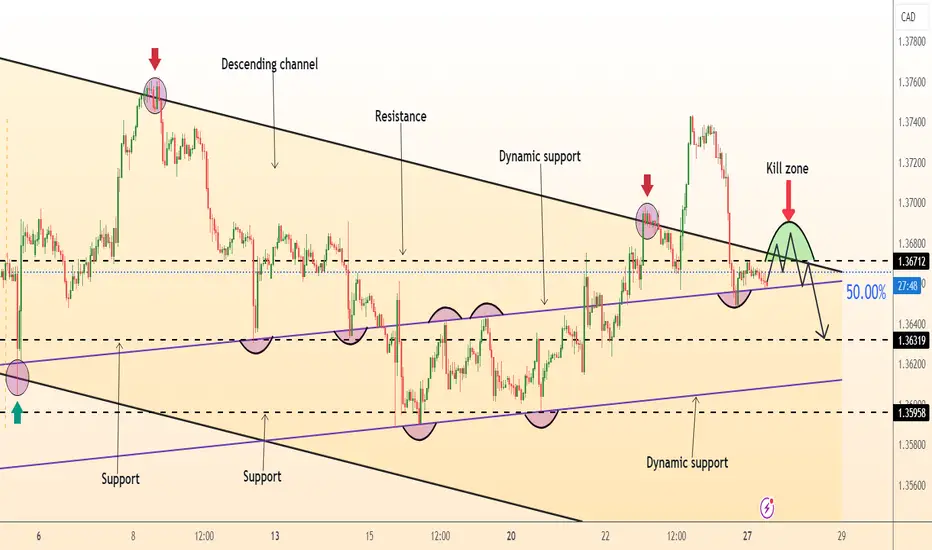
DeGRAM | USDCAD decline from the border in the channelUSDCAD is moving above the trend line in a descending channel.
After a false breakout of the upper boundary, the price has returned to the channel.
The chart is holding under the 50% retracement level of the last bullish impulse.
We expect a decline in the channel after a retest of resistance.
-------------------
Share your opinion in the comments and support the idea with like. Thanks for your support!
Euro / U.S Dollar _ Under _ Trading _ Venue _ FXCMEuro / U.S Dollar _ Under _ Trading _ Venue _ FXCM
Note : Price can be different with other Trading Venue.
Next prices :
$1.08721
$1.08763
$1.08817
$1.08839
$1.08873
1.08889
1.08904
1.08925
Short break from here.

GBPUSD Sell signal for weekHi traders, Here we share with you #GBPUSD sell signal for week. Keep like and comment and flow🙏
