$SPY S&P 500 Quarterly lookA historical look at AMEX:SPY since inception.
By just looking at this chart you can remember the historical events
2008 Financial crisis where buyers stepped in
Covid lows, etc
Chart is broken down in 3 month candles to represent each quarter in the market year
ETF market

Clean Energy ETF $ICLNResistances and Support
3 month candles
Possible bottom looks like it could be in with rising volume


Opened (IRA): BITO July 19th 24 Short Put... for a 1.44 credit.
Comments: High IV at 59.6%.
Looking to pick up shares at or below my covered call's current break even of 27.10.
Metrics:
Buying Power Effect/Break Even: 22.56
Max Profit: 1.44 ($144)
ROC at Max: 6.38%
ROC at 50% Max: 3.19%

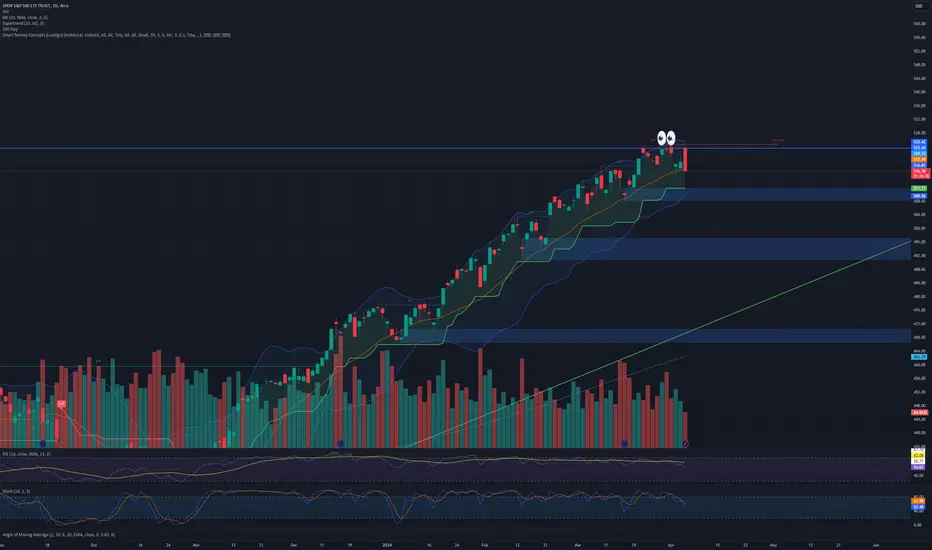
S&P bulls are unstoppable; market reaches new highMarket closed strongly last week after reaching a new historical high. There was some sluggish consolidation on Thursday-Friday but near end of Friday trading hours, bulls put end to it by setting hourly higher low. Friday closed within Thursday’s range after a failed break-out, which is a very bullish signal.
Currently, we have full alignment on all major timeframe: price is in uptrend on weekly, daily and hourly timeframes. There are absolutely no warning signs that would speak for bears.
Both short- and long-term outlooks are bullish. If you're already in a long position, you're fortunate and can rest easy. If you're considering entering the market, you can either wait for another pullback or enter now with a reasonable stop-loss.
FOMC minutes are coming out on Wednesday, which could cause some unexpected volatility. However, if there are no major surprises, the bullish thesis remains unchanged.
Disclaimer
I don't give trading or investing advice, just sharing my thoughts.

China $FXI Perspective 2Broken bullish trend that shows an a successful 1st re-entry, then a 2nd failed re-entry followed by a long bearish downtrend.


QQQ to 380 before Jan 2026?This is a big statement, but this could come true. Just an idea as I don't usually trade QQQ or hold anything for more than a year at the moment. lol. If we did really enter a 5 year bull market last month, then I do feel 380 could be a good price target for a low size position trade.
NFA - just a thought

Bull PutBit of an intro below to my personal trading strategies: (future idea's will be much shorter in text and to the point)....
Most if not all of my trades are based on finding the best Option Combinations for Stocks , Indexes or ETF's which I believe follow a particular trading range. This 'expected' trend is based less on technical indicators and more on the underlying fundamentals of the equities, market psychology and simple supply and demand. To date my preferences for investing in equities goes mainly to the energy market (mainly gas), gold, silver and commodities (uranium, copper and rare earth metals) and last but not least semiconductors while the AI hype lasts.
It doesn't matter if the trend is bullish, bearish or trending sideways, there are always option combinations that can be applied, such as Strangles, Bull or Bear Put/Call spreads, Butterflies, Iron condors, Covered Calls etc. etc.
The interesting aspects of trading in options is that the Risk/Reward ratio can be high. For Put or Call spreads for example, one can easily double/triple the input, depending on the option combination. For butterflies the ratio can even go up to 1:10 or higher (i.e. input $1000 may end up at $10,000 if the butterfly combination comes true). On the other hand, one could easily lose the full invested amount if the underlying equity does not follow your expected trend, but in most cases you will always know the maximum amount you can lose for these option strategies and as such base your trading strategy on these risk/reward levels.
This XME Bull Put is a simple spread to profit while from the S&P Metals & mining ETF if this remains bullish.

Look. If NVDA 1600, SMH could be 300I just longed some more SMH here due to NVDA strength and Semi strength overall
My March 2024 prediction was that NVDA would hit 1000. now that I was right on that move, I believe I'll get my NVDA to 1600.
I'm not holding NVDA calls though, SMH is cheaper for me,
Bears can stay hesitant all 2024 if they want. We entered a 5 year bull cycle. Quote me in 2030
NFA - Good luck

Opening (IRA): TQQQ July 19th 58 Monied Covered Call... for a 55.95 debit.
Comments: Going monied here, selling the -75 call against stock to emulate a 25 delta short put metrics while having built-in intraexpiry defense via the short call. More patient people will probably wait for weakness ... .
I'll generally look to roll out the short call on test or at 50% max/take profit on the entire setup as a unit at 50% of max.
Metrics:
Buying Power Effect/Break Even: 55.95
Max Profit: 2.05 ($205)
ROC at Max: 3.66%
ROC at 50% Max: 1.83%

Closing (IRA): SMH 205/215 Short Put Vertical... for a .87 debit.
Comments: First part of an adjustment trade. Instead of rolling the short put vertical aspect of my 205/215/255/265 up to delta balance, I'm closing it out.
Then, I'll re-erect a 2 x 5 (the equivalent of a 10-wide) to delta balance against the call side, whose short leg is at the 32 delta.

Opening (IRA): EWZ July 19th 31 Monied Covered Call... for a 30.31 debit.
Comments: Decent 30-day IV at 34.0%, but I'm primarily looking to position myself to grab the June dividend. IV is skewed to the put side in this underlying, so the general go-to would be short put, but to grab the dividend, you have to be in stock.
Because I want the extrinsic in the short call to exceed any dividend, I'm basically going at-the-money/slightly monied with the short call and will look to manage the position after the dividend drops. Unfortunately, the distribution has been wildly variant, so it's hard to tell how much extrinsic to keep in the short call to diminish the prospect of being called away early due to some dick exercising their long call early to grab the dividend.
Metrics (Sans Dividend):
Break Even/Buying Power Effect: 30.31
Max Profit: .69
ROC at Max: 2.28%
ROC at 50% Max: 1.14%

Opened (IRA): BITO June 28th 31 Covered Call... for a 27.55 debit.
Comments: Not the weakness I was looking for, but setting myself up to grab the early June dividend.
Generally, I'll look to roll out the short call at 50% max ... .

SPY is gonna crater - NVDA was the sign like Cisco and Enron!Besides the TTM squeeze being fired off - I've seen some hedgies go to cash, PLUS I'm seeing huge dark pool buying for 2x and 3x BEARISH SPY ETF's. I bought some $11 SPXS puts for .07 a piece as a hedge. There was a ton of OI in those calls...
Links to dark pool buying in the comments.

$SPY Triple Top...AMEX:SPY getting spicy here, looks like a triple top for now headed into a lot of world news, ie Iran/Israel/Biden ... I think we've been overdue for a correction, this is a VERY solid base to start a downtrend and fill some gaps before heading back up for Trump Presidency... Buy the rumor stuff...
No positions, will look for continuation tomorrow...
- Prof
$YOLONot financial advice
AMEX:YOLO
Scenario #1 almost to fill the gap in the purple box and bounce from there to turn bullish.
Scenario #2 It retracts at the 0.618 or 0.78 Fibonacci.
Fail to-do so will revisit the lower part of the broadening formation.
like and subscribe for more ideas.
Thanks.

Support And Resistance"Support level 1" refers to a point where a candlestick drops down to wait for the right moment to enter buying at the first upward trend direction.

Utility Buyers Getting GreedyUtility stocks have been on a tear recently. Just a few days ago, 93% of the stocks in the S&P Utilities Index were trading above their 200-day moving average, and now the breadth is deteriorating rapidly with just 80% of these constituents above their respective MAs.
After today's slide, it seems the line of least resistance is to the downside, at least in the short-term.

$SPY May 24, 2024AMEX:SPY May 24, 2024
15 Minutes.
AMEX:SPY opened gap up.
Close was bad. as it closed near low of bar.
Having expected 534 on upside, short opportunity came easily.
We have 2 issues.
AMEX:SPY made ATH. But close in daily and week so far is bad. Near low of bar.
So, if today we have a closure near end of bar in week. Next week we will have downtrend.
So now buy is confirmed only above 533.5 levels.
Till then we keep shorting. For the moment.
For the day any retrace to 529.5 for the fall 531.49 to 524.73 will give opportunity to short.
We are having 517 as 21 EMA in daily.
Thats the target I will short next week.

MSOS - Ascending Wedge- Downward MoveI actually would like to see MSOS move upwards.
The only thing that has me worried is this ascending wedge that is pretty obvious.
Classic move downwards to the .786 Fib around $6.28 range.
The only thing that would catapult it up would be the reclassification to Schedule 1.
I would like to see it break and test the ~$12 area.
The is not trading advice, just something I happened to notice and wanted to share.

Opening (IRA): TQQQ June 28th 53 Monied Covered Call... for a 51.52 debit.
Comments: Re-upping in the June 28th expiry with a monied covered call, as there is no July yet. Selling the -75 delta call against a one lot to emulate the delta metrics of a 25 delta short put to have built-in defense via the short call and to take advantage of call side IV skew.
Metrics:
Buying Power Effect/Break Even: 51.52
Max Profit: 1.48
ROC at Max: 2.87%
ROC at 50% Max: 1.44%
Will generally look to take profit on the entire setup at 50% max.

