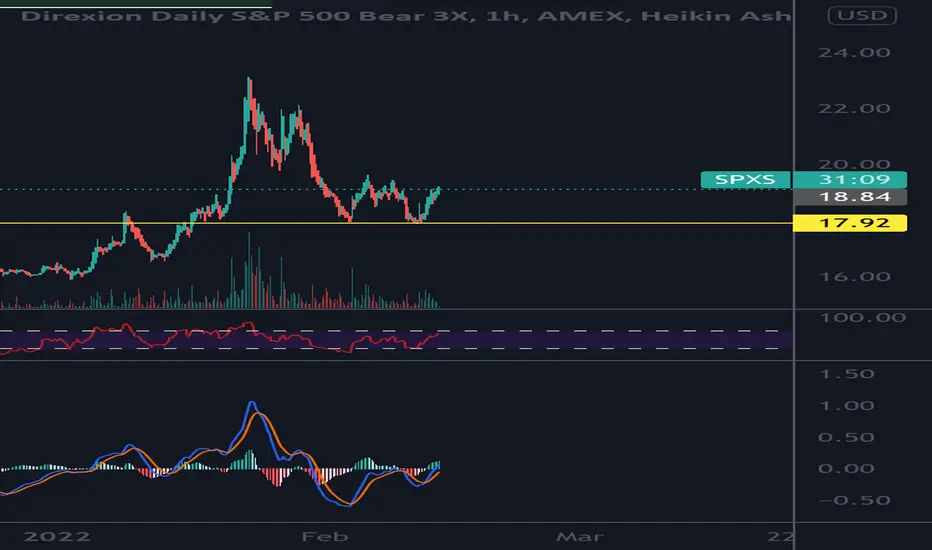
SPXSDivergence. Money!
When spy dumps, this should rise. Made a higher high on indicator, and higher low on chart.
SPXS trade ideas

SPXS callWhy:
1)This one is way oversold.
2)The indicators are at extremes not seen for a long time.
3)Bought April $6 call for $5.75, the premium was only 9 cents.

Bullish IdeaI feel this is a good play because I believe the market ( AMEX:SPY & SP:SPX ) to be in a correction phase of up to around 10% from its most recent weekly peak. I like the idea of AMEX:SPXS bear shares, not only because it behaves the opposite of SP:SPX , but because it's triple leveraged and you can buy for cheap!
From a technical viewpoint I see the following:
Broke above a Falling Wedge Patter (Bullish)
Then consolidated
Formed a double bottom
Cup & Handle pattern on lower timeframe
Price is coming back up on 3 consecutive green weekly candles
It's breaking out above its most recent peak to the left (watch for a retest)
All while Volume is building, showing institutional support behind the move
RSI & MACD indicators confirm the move
MACD shows a recent bullish crossover and rising histogram
RSI is trending up with more room to rise
Important: This is strictly what I feel will happen. It's "not" an entry point. Further analysis is required for a proper entry. Watch for a pullback / retest.
Disclaimer: This is strictly an opinion and in no way is financial advice. There is no such thing as a 100% for sure guaranteed thing. Market conditions can change, there could be news as a catalyst, and strategies don't always work. This idea is merely to engage with the TradingView community. Ideas & comments are always welcome! Lets keep it fun & friendly. =)
Happy Trading!

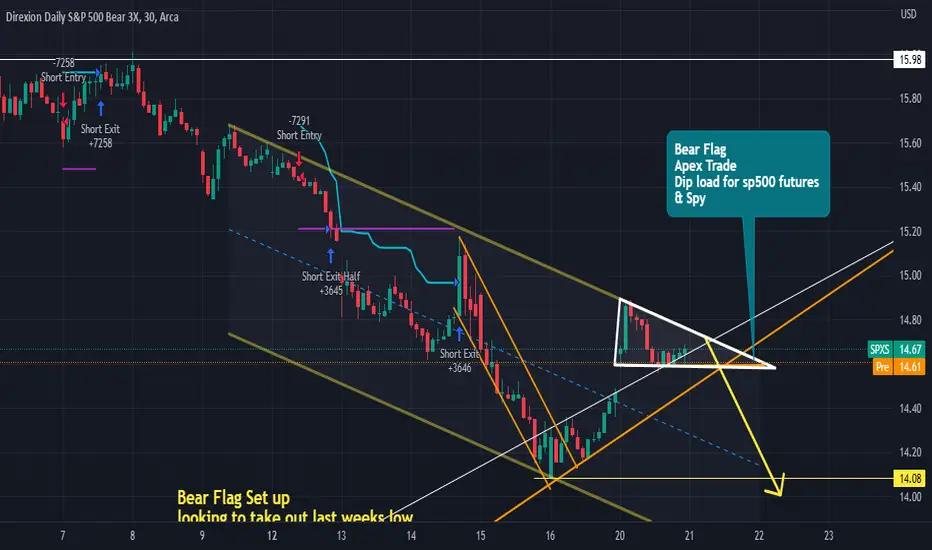
Bear Flag APEX TradeIf you follow my charts, you know I have targets for 4750 & 4900 for sp500 futures all have been confirmed w/ the AD showing Ascending Triangles to those targets. And the AD has also confirmed $475 & $493 for AMEX:SPY etf. I encourage bullish traders to bull all dips.
Another Tale is the Bear Flag Trade in AMEX:SPXS that has been repeating for quite sometime. Here is another clear Bear Flag set up w/ an Apex Trade.
sp500 3x bear waterfall if closes below 14.80the 3x bear etf , has a bearish waterfall set up w/ a close below $14.80.. Thats 10 cents from current price action of 14.90, think about that for a second.. sp500 goes parabolic if the bears gives this up . If you're bullish, you want to see this capitulate

SPX 3x Short ETF Hedge PlayThe SPX looks like it is ready to give us a moderate pullback so I will be playing this via multi-week call options on this 3x-Short SPX Bear ETF
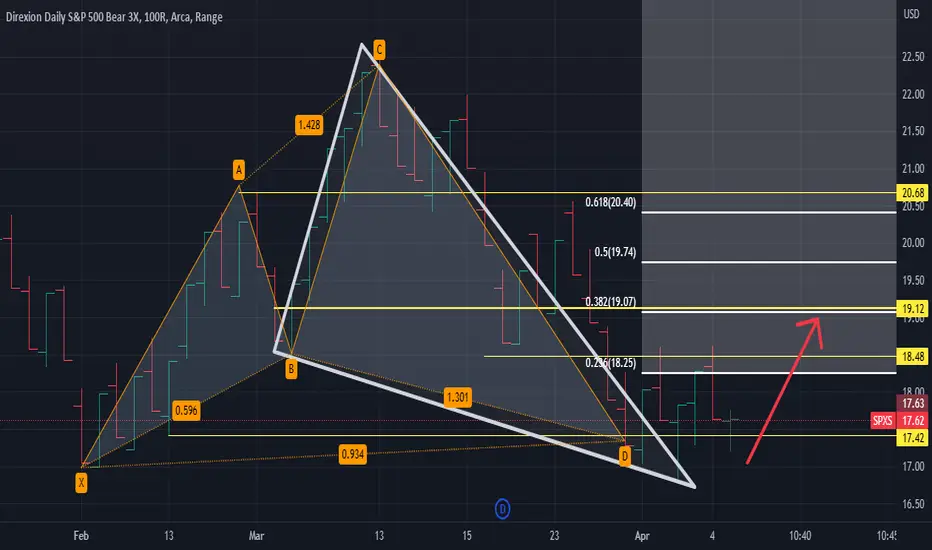
bullish ABCD pattern set up 1st target 17.35, 2nd 19.12 based on the bullish abcd pattern set up.. 1st target is above the .382 fib level for the 1st abcd pattern set up . It also correlates to the sp500 futures min retrace to 4160

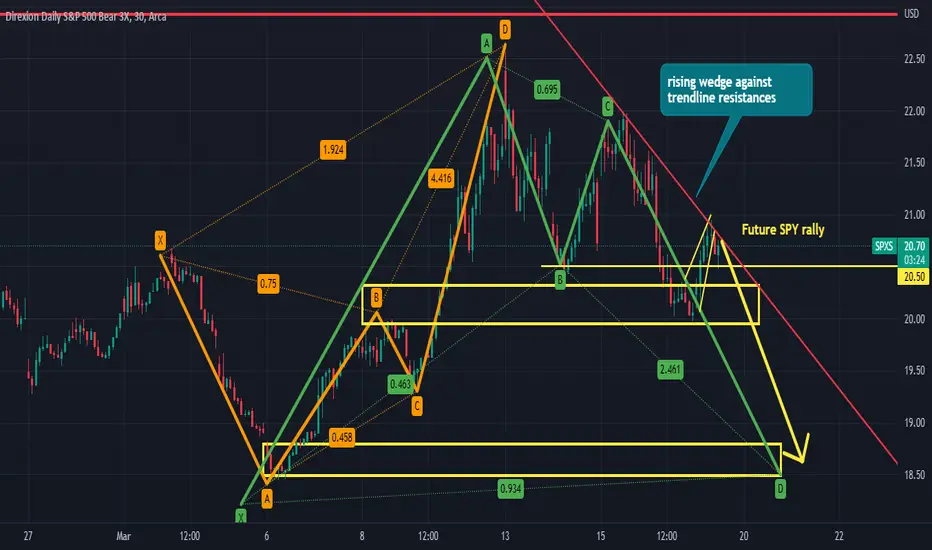
short the C leg of the bullish cypherthere is also a rising wedge into a trend line resistances. The B leg of the previous bearish cypher acted as inital bounce area, as a result I see a future spy rally set up into the close today. This can also push $spy for $400+ $4080 SPX
added looking for $19 areaadding this morning as I anticipate sp500 futures along w/ spy to sell off the rest of this week. im looking for B leg retrace on the bullish cypher near the .382 fib level
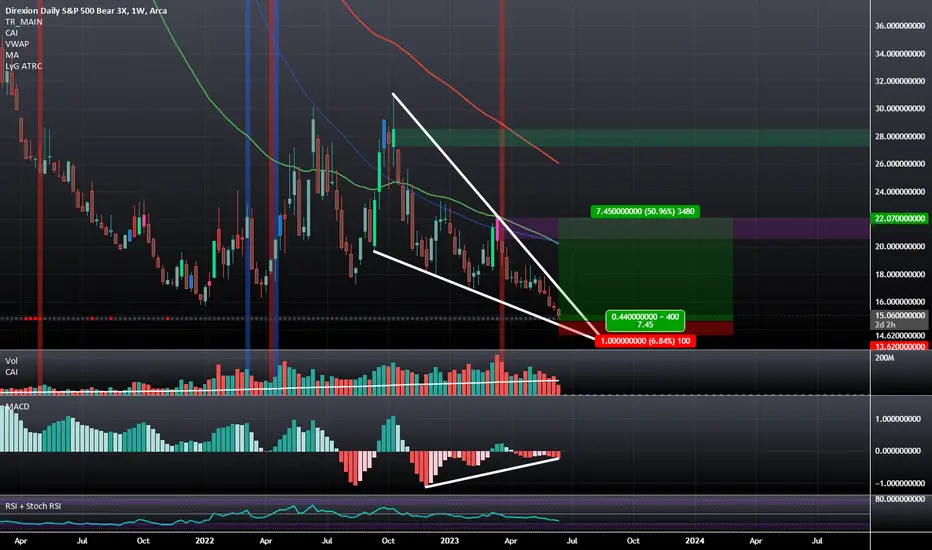
SPX SHORT (SPXS LONG) Shorting the SPX with SPXS (x3 leverage). Eyeing $21usd+ for first take profit and then let it ride from there. I believe we could go up to $35usd +
SL: $17.02

stalking a position near $16, AD showing bullish cypher on weeklthe AD is showing a bullish cypher set up on the weekly chart of spxs, however we're not at the apex of the triangle yet (bottom chart) we're close... this week we have Fed chairman speaking and few other key speakers... could be the right opportunity im waiting for . I also dont mine DCA into a position since this has been beaten down pretty badly already...

SPXS - There be no Bears here - only BullsThere be no bears here - only bulls!
TIP: Using a stochastic with settings of 5 for %K and 5 for %D you can get an idea when prices are bowing into the dance.
When bears become dominate, inverse ETFs become profitable.
SPXS:
Entry (Stop-Limit) - 20.45
Stop Loss - 18.85
First target - 21.36 (+4.6%)
Anticipated target - 23.57 (+15.27)

Head and Shoulders Bottom | 14% move possibleDirexion Daily S&P 500 Bear 3x Shares forms bullish "Head and Shoulders Bottom" chart pattern
"Head and Shoulders Bottom" chart pattern formed on Direxion Daily S&P 500 Bear 3x Shares (SPXS:NYSE). This bullish signal indicates that the stock price may rise from the close of $18.31 to the range of $20.50 - $21.00. The pattern formed over 20 days which is roughly the period of time in which the target price range may be achieved, according to standard principles of technical analysis.
Tells Me: The price seems to have reached the end of a period of "accumulation" at the bottom of a major downtrend; the break up through resistance signals a reversal to a new uptrend.
The Head and Shoulders Bottom is created by three successive declines in the price following a significant downtrend. The lowest low (head) is in the middle, flanked by two higher lows (shoulders) at roughly the same level. Volume is highest as the price makes the first two declines, then diminishes through the right shoulder. Finally volume surges as the price closes above the neckline (drawn between the two highs) to confirm the reversal.

SPXS LONGSAfter this weeks bull run SPXS took a big hit. We are looking for strong support to build once this weeks news settles the markets.


SPXS potential breakout to upside as macro conditions worsenSPXS potential breakout to upside as macro conditions worsen. Peak expected in early February.

Inverse SPX ETFs could be set to fly! Mean reversion is quite the thing, and these have moved a very long way.
The stability of these downtrends broke in 2018, alongside the stability in the SPX uptrend. We've had a big blow off drop and these types of things make people forget obvious warning signs - but this has been flashing up warning signs for a while and they may soon become actionable.
To the moon.

SPXS with "bull market band" and yearly woodie pivotsBased on the TA, it looks incredibly bearish and increasingly comparable to 2019 / 2020.
As a naturally decaying asset SPXS is rarely ever above the weekly 20/21 sma/ema and anytime we anywhere near that should be a serious cause for concern...

SPXS - Target 30.49Definitely, a mix of readings on all chart time frames today. Could swing either way tomorrow. Hopefully, we get a clear bearish/bullish breakout. Daily and weekly traders are up at bat to push SPY up and out of the inside bar. I'll be playing this one tight.

SPXS Daily Nice reversal candle at exhaustion low of broadening wedge close Friday. First three targets are in play starting Monday. This plays right into the analysis of ES/SPY.

S&P500 crashing on march 9tth?look at the higher lows drastically raise, then again this could just be a fake out lol I've seen patterns like this a lot in the past.... n a cup in handle within a cup in handle? lets see if im right...