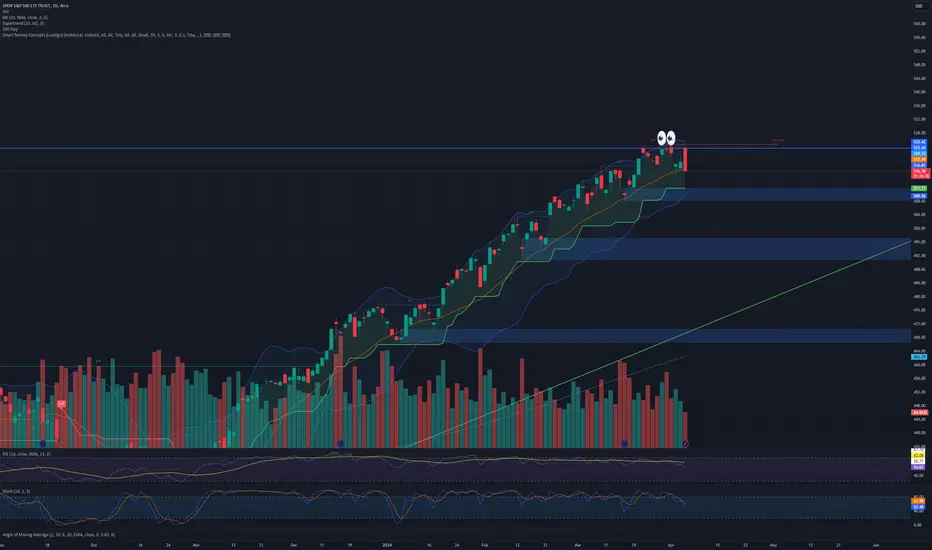
SPY bigger pictureI am going slowly short.
SPY should make another leg down this week.
Level of interest is 475-470
Lets see what Wednesday will bring, until then we should stay flat.
From the lows of 470, we shall do the usual election run.
target 548?
Ill be updating this idea.
SPY trade ideas

SPY levels - Time to be patient Let's quickly review some levels in SPY.
I can see potential support at 525 as a base flip level.
523 also looks like support - here are 21 EMA + the flag bottom + gap fill.
The obvious resistance here is 532-533.
One key thing I want to mention: the market is now ranging, and it's important to be patient and give it some time to form clearer price action and confirm the next momentum.


SPX repeating patternSPX seems to be repeating a previously occured pattern, let's see how this plays out !

$SPY Triple Top...AMEX:SPY getting spicy here, looks like a triple top for now headed into a lot of world news, ie Iran/Israel/Biden ... I think we've been overdue for a correction, this is a VERY solid base to start a downtrend and fill some gaps before heading back up for Trump Presidency... Buy the rumor stuff...
No positions, will look for continuation tomorrow...
- Prof
Market(s) move the world around Events occur around the chart(s) and never vice versa.
Its aways all about WHEN to move the market

Spy is hotLooks like AMEX:SPY can hover here and trade higher from these levels. RSI is hot and momentum is carrying this uptrend. Low volume = sellers not in sight. NASDAQ:NVDA earnings might push it to close above $531.50 by Wednesday. A down day with high volume will be the beginning of a pullback.

$SPY May 22, 2024AMEX:SPY May 22, 2024
15 Minutes.
Oscillator divergence getting sorted out.
At the moment sell below 529.7 and buy above 531.75.
If NASDAQ:SPT crosses 531.75 with bar having close near top, we can buy for 534 range.
And if it closes below 529 with bar close near low of bar i will short for 527.5 levels which also is possible 200 average during the day.
For the day consider the rise 529.07 to 531.51.
AMEX:SPY need to hold 530for a target 533.5 to 534 if 531.75 is crossed.
At the moment AMEX:SPY is struggling around 531.5 three times.
One negative issue I have is, the stochastics had a black bar on top and it retraced say below 25 without creating a black bar at bottom. But once it has crossed 75 there is no black bar on top. So, momentum seems to have lost. Have marked in chart.
So, I will wait for first 15 minutes after open and take a call.

SPY (S&P500 ETF) - Weekly - Potential Resistance Price TestSPY (S&P500 ETF) has been in an uptrend since 2023 and is approaching its all-time-high price resistance again.
$523.07 is the current all-time-high price resistance.
$497.83 is the current support level price, and also the 0.236 fibonacci level.
Bullish Scenario: If SPY price breaks out above $523.07, the next resistance price targets could be: $537, $550, $563, $575.
Bearish Scenario: If SPY price reversse back down, a potential lower-low in the price could be set over time. Support price levels could be: $508, $497, $489, $476, $466.
Note: corporate earnings, FOMC interest rate changes, government legislation, breaking news, and global events could override technical chart patterns.
Date created: 05/10/2024

Yea, its a bull flag or whatever...Its clearly setting up for ATH and a push higher if everything goes accordingly.
What I am looking for is the DXY to push above 105 again and the VIX to start pumping, if these dont happen tomorrow after earnings then we are set up to rally until July - October.
I can see a pump until election time playing out, volatility is about to pick up big time within the next 6 months.

Elliott Wave Analysis on S&P 500 ETF (SPY) Calling for More UpsiShort Term Elliott Wave in S&P 500 ETF (SPY) suggests the rally from 4.20.2024 low is in progress as an impulse. Up from 4.20.2024 low, wave ((i)) ended at 510.75 and dips in wave ((ii)) ended at 499.49. The ETF has extended higher in wave ((iii)) with internal subdivision as another impulse in lesser degree. Up from wave ((ii)), wave i ended at 508.19 and dips in wave ii ended at 499.55. Wave iii ended at 518.57, wave iv ended at 514.98, and wave v ended at 522.63 which completed wave (i).
Wave (ii) pullback has ended at 518.18 which subdivides into a double three Elliott Wave structure. The ETF then extended higher inw ave (iii) towards 531.52 and pullback in wave (iv) ended at 527.32. Final leg wave (v) is in progress and can see a few more highs before ending wave (v) of ((iii)). Afterwards, it should pullback in wave ((iv)) to correct cycle from 5.1.2024 low before it resumes higher. Near term, as far as pivot at 499.73 low stays intact, expect dips to find support in 3, 7, 11 swing for further upside.

Spy Ascending TraiangleTo day we may push pass 531.11 - 531.57
There is a trend line that started on the 17th that now has two touches of support to the upside.

SPY 1H Inside BarEasy plan. A break of either the green level for calls or red level for puts. Range defined in-between.

#SPY Analysis, Key Levels & Targets for DAY Traders #SPY Analysis, Key Levels & Targets for DAY Traders
Today’s Trading Range is a little bit stinky, in my opinion. Implied move from options is small. Volume yesterday was extra stinky low. 37M when everything settled and 11M around 12:30ET…
I don’t like low volume trading so even though I will be trading a little bit what I’m really looking for is VOLUME….
Outside of that - The 35EMA has held us up since FOMC, so that’s the other level I’ll be looking for today.
Complete walkthrough in last nights video. GL today, y’all….

$SPY May 21, 2024AMEX:SPY May 21, 2024
15 Minutes
For the rise 525.18 to 531.52 4SPY earlier had retraced to 527.33.
Being 61.8% retracement usually it will make double top.
On that basis AMEX:SPY hit 531.56 today.
It retraced to 529.17.
Therefore 527.33 can be treated as HL.
Now that number should hold for uptrend.
Hence if we consider the rise from 527.33 to 531.56 AMEX:SPY need to hold 528.5 - 529 levels to continue the trend.
But we have oscillator divergence.
Hence holding 527 is important else we have a target 526-524, 524 being 23.6% retracement for the move 499.55 to 531.56.
Hence for the day
If 527 is broken i have a target 526 which is 200 averages in 15 minutes.
And if 531.75 is broken with good close on bar then target is 534.
I expect a one-sided move today based on open.

SPY to 519SPY is currently in an uptrend, and failure to break and stay above 531 will lead to a double top, which will likely see the stock come back to the 519 level.

Spy 🐻🚩Bear flag showing here on spy and a few other indexes/ sector.
This bear flag would be consider a handle for a inverted cup and handle.
Smaller time frame looks like this spy
And heres NQ
We are headed back to bear flag support around 500.. from there we could either finish one more bounce higher 511-514 before finishing the leg down to 480
The bear flag starts below 500, first target is 495 gap close..
The Inverted cup start below 495... short it and every pop to 480
Vix 2hour - bullish wedge
DXY 4hour - bullflag

SPY What Next? SELL!
My dear subscribers,
SPY looks like it will make a good move, and here are the details:
The market is trading on 529.43 pivot level.
Bias - Bearish
Technical Indicators: Both Super Trend & Pivot HL indicate a highly probable Bearish
continuation.
Target - 519.19
About Used Indicators:
The average true range ATR plays an important role in 'Supertrend' as the indicator uses ATR to calculate its value. The ATR indicator signals the degree of price volatility.
———————————
WISH YOU ALL LUCK

Top hunting the illusive dropStill looking for the spot I am will to short. I see we still could be a week away.
Each day i will post what I see and if a trade develops than we find it together.
I have no idea of these threads having any value to anyone, so comments or feed back woud be great.


Does SPY bottom this week?SPY 5/24 Levels
As AMEX:SPY continues to climb and climb the bull rally has no sign of ending. We are expected to have slight weakness this week although seasonals are indicating this week is the bottom. The weekly levels are :
Market Makers Hedged - Upside $536.50 Downside $521.50
Markets Expectation - Upside $535.13 Downside $524.40
Liquidity Levels - Lay at the market expectations
Pivot - Yellow Box

SPY S&P500 etf Bearish DivergenceIf you haven't already purchased SPY after the 2023 forecast: forecast:https://www.tradingview.com/chart/idea/l6U1M9dJ/
then it's important to be aware that there's a significant bearish divergence in the RSI of SPY, the S&P 500 ETF, which initiated at $469.
Anticipating a technical retracement to $495, given its prolonged period of being overbought!

✅SPY GROWTH AHEAD|LONG🚀
✅SPY broke the key
Horizontal level of 524$
Which reinforces our
Bullish bias and I think
That we will see
A further move up
LONG🚀
✅Like and subscribe to never miss a new idea!✅
