US100 trade ideas

Flat to bullishi dont know what are they doing, but as far a yesterday's move we are into longs. so, flat to bullish buy every retracement. Still given the premarket, well have to wait for the open.


NASDAQ BUY NOWHi Traders we have potential buy trade on NASDAQ. You can place your buys now. trade setup will be update later.

NASDAQ SELL BELOW 18537.40Hi Traders we have portential sell trade on NASDAQ we will only take our sell trades below level of 18537.40

US100 - Broken All Time High | Bull Trap?Nasdaq has broken its all time high of 18500 on march 24. It is currently trading above it but does
momentum supports new high?
As far as volume is concern. There is bearish divergence on volumes. Volumes are on lower sides on this breakout raises eyes on bull trap.
We have another harmonic pattern is forming which supports 18800 to be the reversal points. Making this breakout as fakeout on daily timeframe.
We expect NASDAQ to fall to atleast 18100 level first where analysis will be done once again to carry out next move.
What do you think of its next move?

NAS100 FORECASTThe current forecast for OANDA:NAS100USD indicates a likely bullish trend. As long as the 4h candle opens above 18550, the index is expected to trend upwards, initially reaching 18725 and then continuing to the strong bullish target of 18805. Conversely, if the 4h candle opens below 18550, the trend will likely shift downward, first reaching 18415 and then moving to the strong bearish support at 18330.
Key Levels:
Bullish Line: 18675, 18725, 18805
Pivot Line: 18550
Bearish Line: 18475, 18415, 18330

Professional analysis and strategies, I hope to help youHello, trader.
US _ Nas _ 100 _ Quarter 2 _ X _ Right _
Prices _ Under _ Trading _ Venue _ OANDS
$18,849.7 will be the next price and will create a bearish candle.
We will then expecting the following prices:
The $19416 activity
The $19773.3
The $20098.9
The $20292.2
The $20483.9
Happy trade

US100- CONTINUATION PARTERNNOTE:
Broke previous 4 year high and made a 2 Month Pin. The Pin have been broken and re-tested.
See a 1-2 RTM pattern on Daily as one of the Confirmations.
2HR/4HR: Divergence of the 3 pushes:
Buys in order, and breakout of 1 week Wick fill should be addition to the position a

INSTINCT VS IMPULSEINSTINCT VS IMPULSE
An instinctive trader vs an impulsive trader.
You have to be consistent and persistent.
A proactive trader listens to his guts before acting.
An impulsive trader reacts to his/her emotions rather than instincts and chases the market which ultimately leads to more losses.
It is important to set aside our emotions when trading and accept losses when our Stop Loss is hit as A LESSON AND NOT REALLY A LOSS. This is because, you have the opportunity to review the events that led to the loss (the lesson), and you save your funds/equity (which the SL is designed for).
On the other hand, when you're impulsive and react based on emotions, you're bound to jump back into the market without thinking or planning (instead of being prepared and waiting for the market to come to you). This will lead ultimately to uncontrolled losses which impact on your account and in most cases wipe out your equity.
Goodluck!

NAS100 SHORTNAS100 has reached a new all-time high and now is starting to create a head & shoulders formation. My prediction is that the SHORT will take place between 23-24 May.

my opinion about nasdaq or us100My opinion there’s big bearish for next week so if the price go to that zone you can sell it

Looking for Clues on the Nas100 Index (a short-term outlook)Uncertainty looms as the Nas100 Index currently hovers in unchartered areas of historic highs. We scale down to the lower 15m TF to get a hint of where price could possibly head next.
We personally do not intend to take any long trades until there is a significant retracement into one of the areas of interest on a higher TF as we expect choppy price action due to the uncertainty both buyers and sellers now seem to have concerning market direction.
Price did a major reaction to news on the 15m TF, soaking up areas of internal liquidity to the downside but still did not take out a significant levels of sellside liquidity. Price however, respected initially bearish orderflow and just now tapped back into the orderblock in the 18,750 price region. Due to this, we expect short-term bearish activity over the next few hours that could possibly lead to the downside retracement needed for good market entry in the coming days.
(update) more reactions and volatility on the low TF as price action now violated the previously respected bearish orderflow. We continue to enjoy our view from our seats at ringside while buyers and sellers battle it out in the quest for supremacy.


NAS Buy Idea 5/19/24Looking for NAS to pull back no farther than the somewhere around 18168.8 (Mid-Point of the weekly consolidation + monthly bullish channel mid-point) and then continue bullish to the top of the weekly bullish channel that price is currently in around 19044
**This is for educational purposes only and this is not financial advice because I am not a financial advisor.**

Nasdaq 100 (CME) may fall to 18540.00 - 18630.00Pivot
18800.00
Our preference
Short positions below 18800.00 with targets at 18630.00 & 18540.00 in extension.
Alternative scenario
Above 18800.00 look for further upside with 18920.00 & 19020.00 as targets.
Comment
The RSI is mixed.
Supports and resistances
19020.00
18920.00
18800.00
18737.50 Last
18630.00
18540.00
18440.00
Number of asterisks represents the strength of support and resistance levels.

Buckle Up! Nasdaq Soar on Nvidia's AI Powerhouse ForecastThis analysis examines the potential for continued growth in the Nasdaq-100, fueled by Nvidia's positive earnings outlook. The analysis explores the following key points:
* Nvidia's Strong Earnings Projection: Nvidia, a leading player in the artificial intelligence (AI) sector, recently released a robust quarterly forecast, boosting investor confidence in the technology sector and potentially propelling the Nasdaq-100 to record highs.
* Market Volatility Expected: The analysis acknowledges the potential for significant price fluctuations following Nvidia's earnings release, as options markets anticipate an 8% move for the stock. This volatility could have a ripple effect on the broader "AI Revolution" trade, which has become a dominant force in the stock market.
* Growth Stocks to Consider: The analysis identifies three high-growth stocks with the potential to outperform the Nasdaq-100: Alphabet, Deere & Company, and AeroVironment. Each company is discussed in the context of its specific growth drivers.
* AI and Technology Driving Growth: The analysis concludes by reiterating the significant role that AI and technology advancements play in the Nasdaq-100's overall performance. The ongoing innovation by key players like Nvidia, coupled with the positive outlook for companies like Alphabet, Deere, and AeroVironment, positions the Nasdaq-100 for continued growth.

NAS100 Analysis: Bullish Momentum HoldsHello Everyone,
The NAS100 has adhered closely to our recent analysis. Currently, it's testing the daily support level, which is showing robust resilience. Presently, all indicators suggest further bullish momentum unless the daily pivot point consistently functions as resistance, potentially leading to a retest of the weekly pivot point.
TradeWithTheTrend3344

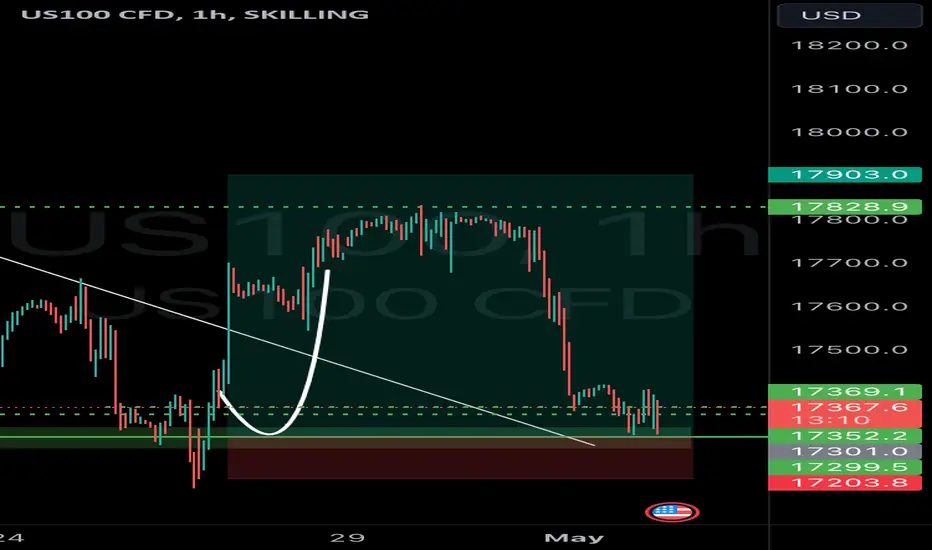
US100 Ready to Test The Top AgainUS100 Ready to Test The Top Again
Price broke out again from a strong resistance zone now turned into support.
The breakout looks solid and after the weaker-than-expected NFP data it looks like the market
may speculate more about a rate cut from the FED sooner than we may expect.
This speculation can push US100 up to the other resistance zones as it is shown in the chart
You may find more details in the chart!
Thank you and Good Luck!
❤️PS: Please support with a like or comment if you find this analysis useful for your trading day❤️

NAS100 Down or Up?NAS has been going up and down for a while now. I'm looking for it to indicate whether we are going to break pattern and move upward.
If not, we will see the lower highs and lower lows start to creep downward today.
If making an entry, I would need to give enough room for retracement either way

USNAS100 (Short Movement ) retracement NASDAQ New Forecast
(Structure: Short)
The price is still retracing towards 18,435 after dropping and stabilizing below the pivot zone, which lies between 18,660 and 18,600.
As long as trading remains below 18,600, the price is expected to drop to 18,435. A subsequent break below 18,420 would signal a continuation of the bearish trend towards 18,250. However, stabilization above 18,435 would indicate a potential bullish trend for the Nasdaq, potentially leading to new record highs.
If the price pushes up from the current level and breaches the pivot line at 18,660, it would support a bullish trend, targeting 18,830 and 19,100.
pivot line: 18600
Resistance Price: 18660, 18880, 19100
Support price: 18435, 18250, 17990
Its range for Today will be between Support 18250 and Resistance 18880
