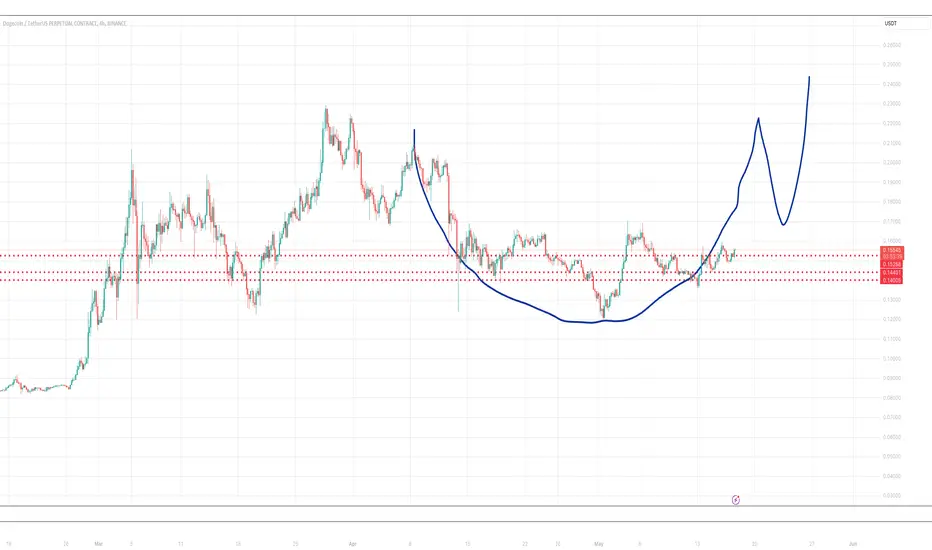
$DOGE Breakout will be SpectacularCRYPTOCAP:DOGE Breakout will be Spectacular
Cup and handle is mega. Jolt to $0.22 then retest of $0.16 and blast off to $0.25+
Do your own resesarch. Never advice.
DOGEUSDT trade ideas
DogeCoin Analysis on the daiy time frame Hello there👋 analysis for BINANCE:DOGEUSDT
CRYPTOCAP:DOGE / CRYPTOCAP:USDT
We have on the Daily time frame : Inverse head and shoulders pattern with a breakout of a downtrend targeting 0.19100$, 0.23700$, followed by 0.33500$ up to 0.4600$
Support : 0.16274$
Do your own research, and trade at your own risk!

DOGEUSDT.1DDOGE/USDT daily chart, several key technical indicators and levels emerge that provide insights into potential price movements.
Trend and Resistance Analysis:
The chart shows that Dogecoin (DOGE) has been in a consolidative phase with the current price around 0.16639 USD. The price is attempting to break above the immediate resistance level marked as R1, around 0.17386 USD. A successful breakout above this level could lead the price to test the next significant resistance at R2, which is around 0.21158 USD. The price is also supported by an upward sloping trend line, indicating a gradual increase in buying pressure.
Support Levels:
On the downside, the primary support level is identified as S1 at 0.12157 USD. This level has shown strong buying interest previously and could act as a floor if the price starts to decline. Below S1, the next significant support level is S2 at 0.07600 USD, which has been a critical support zone in the past.
RSI and MACD Indicators:
The Relative Strength Index (RSI) is currently at 57.33, indicating a neutral to slightly bullish position. The RSI is in the middle range, suggesting that the market is not yet overbought or oversold, providing room for potential upward movement. The Moving Average Convergence Divergence (MACD) indicator shows a bullish trend, with the MACD line (blue) slightly above the signal line (orange)
and the histogram indicating positive momentum. This suggests that bullish momentum is currently building.
Volume Analysis:
The volume pattern indicates moderate trading activity, with no significant spikes during recent price movements. This suggests that there is a balanced participation from both buyers and sellers, contributing to the current consolidation phase.
Conclusion:
In conclusion, the DOGE/USDT pair is currently in a consolidative phase with a slight bullish bias. The RSI indicates a neutral position, while the MACD suggests building bullish momentum. Traders should closely monitor the support levels at 0.12157 USD and 0.07600 USD, as well as the resistance levels at 0.17386 USD and 0.21158 USD. A break above the resistance levels would confirm a bullish trend continuation, while a failure to hold the support levels could lead to further declines.
Overall, the market sentiment for DOGE remains cautiously optimistic, with critical attention needed at the aforementioned levels and indicators to make informed trading decisions.

Alikze »» DOGE | Ready to defeat the PRZ zoneAccording to the previous analysis in the currency post that was mentioned, it faced a negative reaction in the second PRZ area and corrected according to the movement path to the specified areas.
💎 But now, due to returning from the specified area, it has attacked PRZ again with a good momentum.
💎 Therefore, this return wave can break the area for the next target, which is the supply area, if it can return in the specified area.
💎 In addition, if this pattern is completed, it can form a data valley, which can continue the path according to the previous post after completing the last log.
💎 Alternative scenario: in case of a break, the green box area can continue to be modified until the next area, which should be reviewed and updated again.
»»»«««»»»«««»»»«««
Please support this idea with a LIKE and COMMENT if you find it useful and Click "Follow" on our profile if you'd like these trade ideas delivered straight to your email in the future.
Thanks for your continued support.
Sincerely.❤️
»»»«««»»»«««»»»«««

DOGEUSDT BUY TO 0.1800Doge have been moving in a falling wedge chart pattern am expecting a breakouts and price corrections above 0.15400 Am selling a setting a buystop order at 0.15413
JOIN AND ENJOY
Tell us what you think.........?

Symmetrical TriangleA symmetrical triangle is a chart formation where the slope of the price’s highs and the slope of the price’s lows converge together to a point where it looks like a triangle.

DOGEUSDT 23 May 2024 ( Result : In profit ) As you can see , we analysed Doge coin technically and it was kindaa obvious that it's gonna up !
so , we are in profit and KEEP in mind that I only trade spot for crypto market !


Doge Bounces at Key Retracement LevelMuch has been said about Doge. Setting aside opinions, we focus here on the chart analysis: and it is clearly bullish. We see in the weekly chart that the Doge price bounced precisely at the 61.8% retracement of the upward movement between October 2023 and March 2024. Additionally, the weekly candle of the first week of May formed a long lower wick. Therefore, we position ourselves long and choose the target area at 0.35 USD.

Doge Potential Buy Zone (10cents to 12 cents)Good Buying opportunity on dogecoin.
Buying zone - (0.10-0.12)
Target- (0.33 cents)
Just wait a bit to reach doge to hit our buy zone.
Cheers!

DOGE MONTHLY BREAKOUT? PLUS INV HEAD AND SHOULDERSObserved massive rally after the effects of the CPI report that surge BTC price past 6% and followed by other major coins. Now, I will tackle the possible BINANCE:DOGEUSDT breakout after the rally on the almost 2-month diagonal resistance trendline along with an inverse head and shoulders, a bullish pattern since the coin is on the downtrend that can be a sign of trend reversal for the coin.
Other details for the setup and the approach for DOGE will be discussed in the idea threads below. Stay tuned!

New update on DOGEUSDTThis chart is only for practice and not a financial advice. Please share your opinion about what do you think? Do you agree with upcoming targets? Do you have any idea about the tume frame for DOGE's ATH?

IS DOGE READY?Dogecoin is a coin that sometimes is unpredictable. When uncle Musk decide that the time is arrived, DOGE pump without any reason. I think the time will come again, and looking at the chart i think we will see a pump soon. I drawed a key resistance line that i expect that got broken in a few days. As soon as we will close above this trendline, i will wait a pullback before opening a long trade targeting the resistance area at 0.20

DOGEUSDT in Symmetrical triangleDOGEUSDT is forming symmetrical triangle with no divergence. It will continue its bearish pattern. Trade has been set considering a bearish breakout.

DOGEUSDT.1DUpon examining the DOGE/USDT daily chart, several key technical indicators and levels emerge that provide insight into potential price movements.
Trend and Resistance Analysis:
The chart shows that Dogecoin (DOGE) has faced some consolidation recently, with the current price at approximately 0.14932 USD. The price is currently trading within a range, attempting to break out. There are two major resistance levels to watch: R1 at 0.17386 USD and R2 at 0.21158 USD. A successful break above R1 could lead to a further rally towards R2, indicating increased bullish momentum.
Support Levels:
On the downside, the primary support level is identified as S1 at 0.12157 USD. This level has shown strong buying interest previously and could act as a floor if the price continues to decline. Below S1, the next significant support level is S2 at 0.07735 USD, which has been a critical support zone in the past.
RSI and MACD Indicators:
The Relative Strength Index (RSI) is currently at 48.55, indicating a neutral position. The RSI is neither in the overbought nor oversold territory, suggesting that the market is currently undecided and waiting for a clear direction. The Moving Average Convergence Divergence (MACD) indicator shows a bearish trend, with the MACD line (blue) below the signal line (orange)
, but the histogram indicates decreasing bearish momentum, which could signal a potential reversal if it continues to move towards the positive territory.
Volume Analysis:
The volume pattern indicates moderate trading activity, with no significant spikes during recent price movements. This suggests that there is no strong conviction from either bulls or bears, contributing to the current consolidation phase.
Conclusion:
In conclusion, the DOGE/USDT pair is currently in a consolidation phase, trading within a range and showing neutral indicators. The RSI indicates an undecided market, while the MACD suggests potential for a bullish reversal if bearish momentum continues to weaken. Traders should closely monitor the support levels at 0.12157 USD and 0.07735 USD, as well as the resistance levels at 0.17386 USD and 0.21158 USD. A break above the resistance levels would confirm a bullish trend, while a failure to hold the support levels could lead to further declines.
Overall, the market sentiment for DOGE remains cautious, with critical attention needed at the aforementioned levels and indicators to make informed trading decisions.

$DOGE Daily Chart Inverse Head and ShouldersCRYPTOCAP:DOGE Daily Chart Inverse Head and Shoulders
On the daily chart an inverse head and shoulders is completing with a target above.
Do your own research.

DOGE TM : 1hHello traders.
I hope you doing well.
These areas are based on my personal strategy and I will share it with you.
Open a sell position on the supply area or open a buy position on the demand area.
Your entry point, stop loss, and target point are based on money management and the amount of money in your trading account.
But I promise you that by trading in the areas of my trading strategy, you will definitely make a profit, because these areas, although they seem simple, are my experience of 8 years of learning and trading.
I hope you will achieve maximum continuous profit with me by using supply and demand areas.
Good luck traders.
Mohammad Goodarzi

DOGE and AIBased on the technical data from the attached DOGE/USDT chart, it can be inferred that the price is likely to decline. Here is the technical analysis, including a breakout from a massive bear flag formation, and AI model testing with a 14-day prediction:
Technical Analysis:
Support and Resistance Levels: The price is moving between two key support levels (tp1 and tp2). A break below these levels could signal further decline.
Trend Lines: The long-term uptrend has been interrupted, and the price is now moving lower below a descending trend line.
Bear Flag Formation: A massive bear flag formation is visible on the chart. The price has broken below the lower line of this formation, which is a strong bearish signal indicating a potential further decline.
Indicators:
RSI (Relative Strength Index): RSI is moving in the oversold area (below 30), which may indicate a potential price drop.
MACD (Moving Average Convergence Divergence): The MACD line is below the signal line, and the histogram shows negative values, indicating a bearish trend.
Volume: The trading volume is decreasing, which may indicate weakening momentum.
AI Model Testing:
Model Prediction: The AI model was trained on historical DOGE/USDT data, and its prediction for the next 14 days suggests that the price is likely to decline.
Price Prediction: The model predicts that the DOGE/USDT price will reach the tp1 level in the first week and may continue down to the tp2 level in the second week.
Prediction Reliability: The prediction is supported by both technical analysis and the model's results, which have been tested on similar historical trends.
Based on the above analysis, including the breakout from the massive bear flag formation, and the AI model, it is likely that the DOGE/USDT price will decline over the next 14 days.

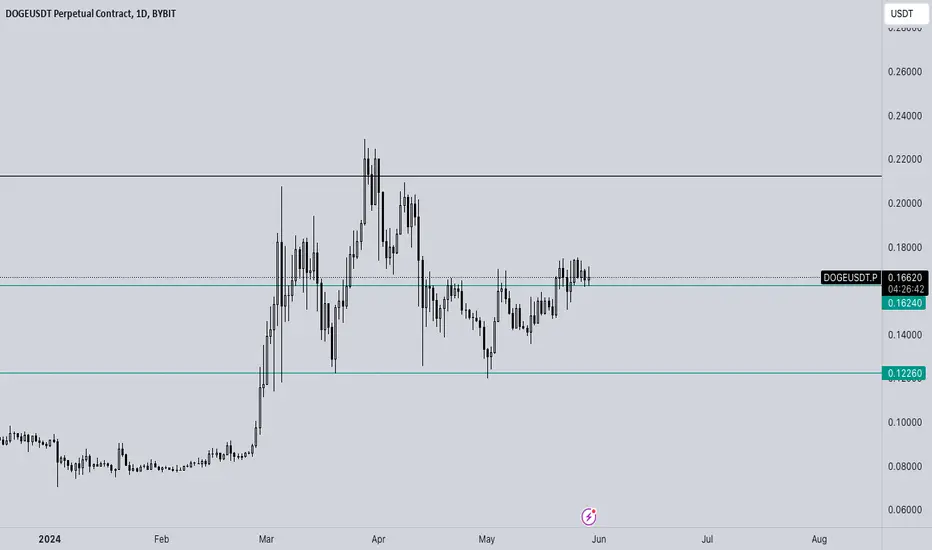
DOGE - Ranges overview Here is a quick look at DOGE.
We are trading in a clean range within defined highs and lows (buyside liquidity and sellside liquidity).
IF we hold the current levels we should expect further pa to the upside targeting the liquidity sitting around 0.21000$
IF we fail to hold the current levels and close below (clean candle close) the current lows expects us to hunt the sellside liquidity sitting around 0.12260$
No need to front run the market...BE PATIENT AND ACT
Stay safe and never risk more than 1-5% of your capital per trade. The following analysis is merely a price action based analysis and does not constitute financial advice in any form.
retest 15 minIn the 15-minute and 4-hour chart, we see that it is possible to test lower levels in the range of 0.16 and then reach 0.2.
In the 4-hour time frame, rsi has reached the overbought zone

Long trade 22nd May 24
13,00pm
New York Session
15min TF Entry
Structure - Day
Entry 0.16787
Profit level 0.17340 (3.26%)
Stop level 0.16484 (1.80%)
Observed
RSI 55.41 & MA - 51.37
Divergence - Vol Analysis (Whykoff method) Trending inside the range.
Chasing Sellside liquidity

Doge 15-20% Short Opportunity This is a tripple top or “Big M” Pattern
Below the line is support, but always creates a fake break before dump so dont be fooled.
Short Doge @ 0.157 box
TP / Look to close @ 0.131-0133
It forms an ever bigger M and could go lowet
Good Luck

DOGEUSDT (1H) Short ThermThe information contained herein has been prepared for general information purposes only. The comments and recommendations contained herein are based on the personal opinions of commenters and advice givers. It should not be interpreted as a recommendation to buy or sell any investment instrument or a promise of return. These views may not be suitable for your financial situation and risk and return preferences. Therefore, making an investment decision based solely on the information contained herein may not produce results that meet your expectations.
