FTMUSDT.PS trade ideas

FTM - ready to pump???Attractive FTM chart ready to move to the top of the channel
Are you ready????

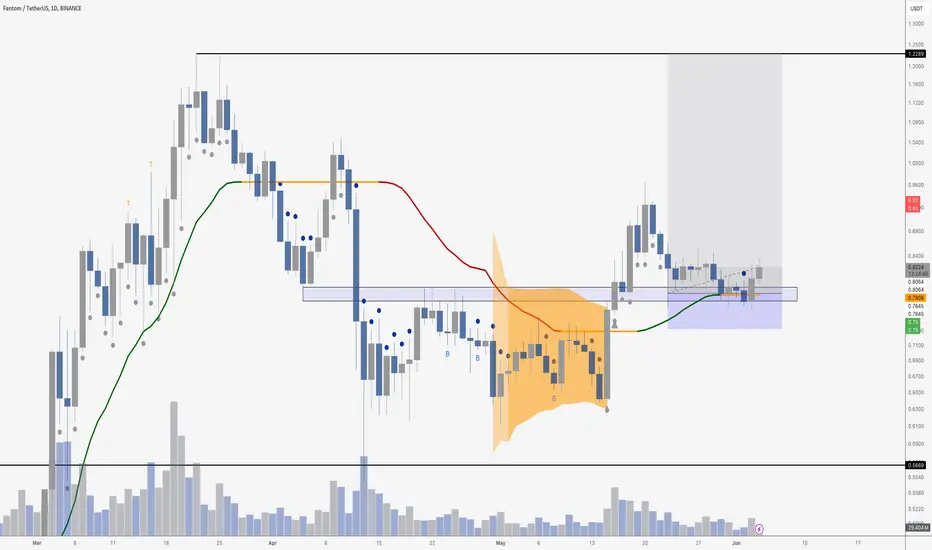
FTM: A massive move is coming! The price is at the apex of the triangle pattern, and a bigger move is coming! If you're looking to trade FTM at the moment, here's a quick setup that you might find helpful!
The idea is: Buy when the price breaks above 0.809$ and take profits at the levels shown in the chart.
Targets:
1. 0.828$
2. 0.85$
3. 0.87$
-------------------------------------------
About our trades:
Our success rate is notably high, with 10 out of 11 posted trade setups achieving at least their first target upon a breakout price breach (The most on TW!). Our TradingView page serves as a testament to this claim, and we invite you to verify it!

FTM: Keep an eye on this level! (Updated entry level)If you're looking to trade FTM at the moment, here's a quick setup that you might find helpful!
The idea is: Buy when the price breaks above 0.83$ and take profits at the levels shown in the chart.
Targets:
1. 0.85$
2. 0.87$
3. 0.9$
-------------------------------------------
About our trades:
Our success rate is notably high, with 10 out of 11 posted trade setups achieving at least their first target upon a breakout price breach (The most on TW!). Our TradingView page serves as a testament to this claim, and we invite you to verify it!

Chart Idea - FTMUSDT Swing LongBeautifully retraced to 618 fib level and now it's way to it's TPs. Please see the originally posted chart few weeks back

Chart Idea - FTMUSDT Swing LongFTMUSDT broke out from it's long bull flag. There are 3 confirmations which lead me to open this long trade.
Bounced
- from the 0.786 fib level
- from upward diagonal support
- from the diagonal support which was the resistance last year in Feb 2023
Entry: 0.76
TP: 1.95
SL: 0.618
It's a swing trade and could take weeks to play out. Will keep on updating on this thread.

Fantom gold signal#Phantom price has maintained the support level of $0.7700 to $0.8200. After reaching the uptrend line, it went through wave 1 and has now completed its correction.
After consolidating in a range and correction, the price could start wave 2 and now reach the $1.0300 target from these areas.
Considering the strong potential of this project, both technically and fundamentally, very good prices can be predicted for it. Technical indicators have also shown strong upward divergence

FTM D1 LONGAny bottom can be an entry point. Phantom is one of the good cryptocurrencies and has good growth potential technically. If Bitcoin breaks the intermediate resistance, this could also reject the high

$FTM Bull Case - Multiple TargetsBINANCE:FTMUSDT is looking quite bullish, with a very clean chart and well respected Fibonacci retracement levels.
The support is sitting right at 61.8% of the last leg up. (Common reversal level)
I think the chart is open to multiple interpretations, each with a different target:
Descending Triangle : $1
Also a key psychological level and a previous resistance.
Bull Pennant : $1.15
Previous resistance and close to the top from last March.
Elliott Wave W3 : $1.3 or $1.62
If $0.76 is the local bottom, it would be a perfect Wave 2 end (61.8% of Wave 1).
According to Elliott Wave theory, the Wave 3 target would be either $1.3 (161.8% of W1) or $1.62 (261.8% of W1).
$1.3 is also a key support from 2021/2022.
$1.62 is also a resistance from 2022.
My strategy for this will be:
Open a long position after a break above the resistance trendline, with a wide SL
Take partial profits at each target
Starting from $1.15, move my SL up below the previous target
Not Financial Advice

FTM LOOKS BULLISHI still like Fantom here, bouncing well from the support zone. This is merely an update on a setup that I shared last week - it dipped below the entry, but did not come anywhere near the proposed stop. Now it’s back in profit and still looks solid.
Fantom (FTM): Possible Re-Test of Neckline ZoneFantom has had a really nice breakout since forming that cup&handle pattern on a daily timeframe.
We are looking now for that broken zone to be re-tested while forming a small triangle formation here with a potential breakout moment!
Swallow Team

just an IDEA !!!!!!In the zoomed-out view on the 1D and 4H charts, we are in an upward channel. On the 1D chart, we have already hit the middle line, which is acting as resistance. Same Within this channel in 4H, we were in a range area that we broke out of on the upside. I believe we have already hit the target of this range area, which is exactly at the middle line of the 1D uptrend channel. Now, based on the RSI and a small support line, I think it is possible to form a small head and shoulders pattern. If this pattern forms, we could follow its target to go back down, aligning with the Fibonacci retracement levels of 50-61.8%. This would bring us back to our support line, where we can then observe how the price reacts.

$FTM Poised to Make a Move? After consolidating in a range and correcting for ~ a month, UPCOM:FTM looks ready to thrust into a wave 3 that has the potential to double its price after the completion of 5 waves.
I remain bullish on this project given the new branding, but more importantly, the technical indicators have also shown a strong bullish divergence on the 8hr TF and the wave counts look fantastic.
Be careful to manage your risk as we could still correct further. The most recent impulsive wave looks to have an awkward correction, or I've counted this incorrectly.

FTMUSDTFTMUSDT is trading in falling wedge pattern. The price was reacting well the support and resistance of wedge.
Currently the price has given the massive breakout from falling wedge and after successful retest of the level will be bullish signal and seems like the price may go for another leg higher.
If the breakout sustain to upside the optimum target could be 0.9150.
What you guys think of this idea?

Just an IDEA ( FTM 1D )I think we are not in a good situation right now, and we need to follow this trendline. Since the EMA 200 daily is under this trendline, it is very important.
We could hope that if we lose the trendline, We might go down with a shadow, touch the EMA 200, and then go back above the trendline again. Meanwhile, 0.55 is still a good level to consider.
Bullish Scenario:
If FTM can maintain above the trendline and the EMA 200, we might see a rebound towards the resistance levels at 0.8132 and potentially 1.0348.
A break above 1.0348 could signal a stronger upward movement.
Bearish Scenario:
If FTM breaks below the trendline and fails to hold the EMA 200 support, we could see a drop towards the 0.55 support level.
The worst-case scenario THAT I DONT WANT TO Consider YET , is that we could see FTM dropping to around 0.42-0.43.
let me know what you think please

Trade Signal for FTMUSDT: Buy PositionDirection: Buy
Enter Price: 0.8049
Take Profit: 0.835
Stop Loss: 0.767
Justification for the Forecast:
The forecast for the FTMUSDT currency pair has been generated using the EASY Quantum Ai strategy. The following key factors were considered in making this prediction:
- Technical Indicators: Our strategy assesses multiple technical indicators, such as RSI, MACD, and moving averages, which currently signal an upward trend. The indicators have aligned to show bullish momentum, suggesting that entering at 0.8049 could yield a profitable outcome.
- Support and Resistance Levels: Analysis of recent price movements has identified strong support around 0.767 and significant resistance near 0.835. The entry price of 0.8049 positions this trade favorably within these levels, maximizing potential gains while minimizing risk.
- Market Sentiment: Sentiment analysis, taking into account both social media and news outlets, indicates growing positive sentiment for FTM. This suggests increased buying pressure, further supporting the bullish outlook for the pair.
By leveraging the sophisticated analysis capabilities of EASY Quantum Ai, we have identified an optimal entry point and set realistic targets for both take profit and stop loss, ensuring a balanced risk-to-reward ratio.

FTM shortFTM bounced off the upper boundary of horizontal channel. Bearish movement to support level at 0.779 is expected to happen.

Bullish update on $FTMUPCOM:FTM still looking extremely bullish just like other Altcoins, if it holds the deviation below and breaks above resistance, the next target above will be our destination.

FTMUSDT Wait to buy or buy now - ready for a big jumpFTM is good to buy now for a bigger wave in bigger timeframe.
In the small timeframe, it could jump up to 0.84-0.86.
Then it will make a correction to 0.7 to complete full ABC.
After that, following Down theory, it will make another wave up to 1.5

Fantom / FTM analysisFtm pumped almost 300% since Andre Cronje back as vice president of memes at the fantom foundation!
FTM has been one of the best performing tokens of 2023, pulling off a series of impressive gains in the last few weeks the price of Fantom is $0.54 today with a 24hour trading volume of 650 million dollar. This represents a 15% price increase in the last 24 hours and a 170% price increase in the past 30 days.
Blockchain platform Fantom plans to introduce version 2 of its fusd stablecoin to provide a more predictable and budget-friendly system for builders, partners and users, developers said in a post over the weekend. They didn't give a timeline for the release.the new version will allow the stakeholders to allocate fees in either fantom or fUSD and to predict future costs based on usage, the developers said. It will allow programmers to build additional institutional products for users and provide a more consistent system for planning and budgeting for grants. while ftm has been on an upward trend since the first week of the year, its price rally in the last week can be attributed to Fantom’s recent integration with the Axelar Network.on Jan. 24, the Fantom Foundation announced a partnership with Axelar, which will introduce interchain communication to the Fantom Network.
since we published our first ftm chart and hit all targets (100% gain) its time to look at the chart again and set new targets. ftm successfully broke ascending triangle and broke 0.29 and 0.31 resistance as well. next targets for ftm is 0.65, 0.75 and 0.8$
what do you think about ftm price ? bullish , bearish or apish!?

I am Long on FTM 4HTFFTM looking good for long lets see, i am wrong or right
targets and entry are mentioned

$FTM continuation to the upside Simple idea, simple execution imo.
With the recent $10 million investment from renowned backers, my confidence in UPCOM:FTM has only grown stronger.
This significant injection of capital underscores the immense potential of UPCOM:FTM and the trust that influential investors have in its future.

Bullish update on $FETFET still looking extremely bullish just like other Altcoins, if it holds and breaks above resistance the next target above will be our destination.
