FTSE BURSA MALAYSIA KLCI INDEX NEW OPPORTUNITY! MYR TO USD!As you see all indicators broke their resistance lines and new upper trend is occurring.
KLSE trade ideas

FBM KLCI Reaching Swap Zone The FTSE Bursa Malaysia Kuala Lumpur Composite Index (FBM KLCI) is a prominent benchmark of the Malaysian stock market, reflecting the performance of the top 30 companies listed on Bursa Malaysia. Over the past six months, the FBM KLCI has experienced a dynamic interplay of local technical factors, global economic sentiments, and the performance of major indices such as the Dow Jones Industrial Average and the NASDAQ Composite.
Technical Analysis of FBM KLCI
From a technical analysis perspective, the FBM KLCI has exhibited significant fluctuations. The index started six months ago at around 1,430 points and has seen a series of rallies and pullbacks. Below are the indicators used which have provided insights into these movements:
1. Moving Averages: The 50-day moving average (MA) and the 200-day MA have been critical in determining the trend. On September 19 2023, the Golden Cross can observed indicating a bullish reversal trend in a longer term. The said reversal validated with the index crossed and maintained above the 50-day MA.
2. Relative Strength Index (RSI): The RSI has oscillated between 30 and 70, reflecting alternating periods of overbought and oversold conditions. Notably, the RSI dipped below 30 in early January 2024, signaling an oversold market and triggering a subsequent rally. By mid-April, the RSI approached 70, suggesting overbought conditions and prompting a minor correction.
3. Support and Resistance Levels: The key support levels at 1,600, 1,575 and 1,530 points, with resistance around 1,620 and 1,640 points. These levels have been tested multiple times, indicating strong market psychology at these price points. The index’s ability to stay above the 1,600 and 1,500 support levels have been crucial in maintaining investor confidence.
Impact of Global Sentiments
Global economic sentiments have significantly influenced the FBM KLCI's performance. Over the past six months, several factors have shaped investor behavior:
1. Inflation and Interest Rates: Rising global inflation rates and corresponding interest rate hikes by central banks, especially the Federal Reserve, have created a challenging environment for equity markets. These moves have led to increased volatility in emerging markets, including Malaysia, as investors seek higher yields in safer assets.
2. Geopolitical Tensions: Ongoing geopolitical tensions, particularly in Eastern Europe and trade tensions between major economies, have affected market sentiments. These uncertainties have led to risk-off behaviors, with investors pulling out from riskier markets, thereby impacting the FBM KLCI.
3. Economic Data: Positive economic data from the US and China have had a mixed impact. While strong US economic growth has supported global markets, it has also led to fears of more aggressive monetary tightening. Conversely, China’s economic recovery has positively influenced commodity prices, benefiting Malaysia's export-oriented economy.
Correlation with Dow Jones and NASDAQ
The performance of the Dow Jones Industrial Average and the NASDAQ Composite over the past six months has provided a significant context for the FBM KLCI's movements:
1. Dow Jones Industrial Average: The Dow has seen a robust performance, driven by strong corporate earnings and a resilient US economy. This upward momentum in the Dow has had a positive spillover effect on global markets, including the FBM KLCI, particularly when US economic data beats expectations.
2. NASDAQ Composite: The NASDAQ, with its heavy concentration of technology stocks, has experienced more volatility due to rising interest rates, which typically hurt growth stocks. This volatility has sometimes spilled over into the FBM KLCI, especially on days when tech stocks see significant sell-offs.
FBM KLCI Outlook
A mixed outlook on the FBM KLCI for the next few months:
1. Cautious Optimism: Given the technical indicators showing a potential for short-term gains, combined with support levels holding firm, there is cautious optimism.
2. Risk Management: With global uncertainties still prevalent, traders usually maintain a diversified portfolio to mitigate risks with a balanced approach, including defensive stocks and those with strong fundamentals.
3. Monitoring External Factors: Keeping a close watch on global economic indicators, especially US inflation data and Fed interest rate decisions, is crucial. Any significant deviations from current expectations could lead to heightened volatility.
The FBM KLCI's performance over the past six months reflects a complex interplay of technical patterns, global economic conditions, and influences from major US indices. While there are opportunities for gains, given the index currently at the key swap zone , investors usually to proceed with caution and remain vigilant to global developments.
Disclaimer:
The information provided is for educational and informational purposes only and should not be construed as financial advice. Before making any investment decisions, individuals should conduct thorough research and consider their financial situation, risk tolerance, and investment objectives.
Investing in stocks involves significant risk and may not be suitable for all investors. The value of stocks can fluctuate and may result in partial or total loss of investment capital. Past performance is not indicative of future results.
Furthermore, the content provided does not constitute a solicitation or recommendation to buy, sell, or hold any particular security or investment strategy. Investors are encouraged to consult with a qualified financial advisor or investment professional before making any investment decisions.
All investments carry risks, including the risk of loss of principal. Investors should be aware of the potential for volatility, market fluctuations, and geopolitical events that may impact the value of their investments.
Investors are solely responsible for their investment decisions, and any reliance on the information provided is at their own risk. The author and publisher of this disclaimer disclaim any liability for any direct, indirect, incidental, or consequential damages arising out of or in connection with the use of the information provided herein.

Time Cycle Analysis: KLCITime Cycle Analysis: KLCI above 1552 is bullish, below 1552 bearish. April 8, 2024, total solar eclipse will cross North America, passing over Mexico, the United States, and Canada which according to Chinese Ancient Culture this day will associate with negative qi. Next key date to watch is 9 Sept 2024.

KLSE to pullback to 1500 level?KLSE might pullback to 1500 before resuming higher. As of today, KLSE should be able to defend the 1500 level and going much higher. Will it advance before CNY next week? Let’s see.

KLSE Interesting Period ahead KLSE Index is getting an interesting phase with long term support and medium term downturn is converging. Over the next 3 - 6 months we should see a breakout from the long triangle build up. Looking at the short term build up it looks like an upward bias for now.. Lets see how this plays out.

Time Cycle AnalysisKLCI above 1552 is bullish and below 1552 is bearish. The most likely trajectory is heading south. Following the discontinuation of UPSR and PT3 by the Ministry of Education, there is a discernible decline in the commitment of our students towards their academic responsibilities. The absence of these benchmarks has resulted in a lack of effective evaluation tools for assessing students' learning abilities. This concerning trend raises the prospect of a nation destined for failure if not appropriately addressed.

KLSE bullish but there might be pullback lower.KLSE has made a good progress higher. However at this current level there might be a pullback lower towards 1460 area before resuming higher towards 1525 area.

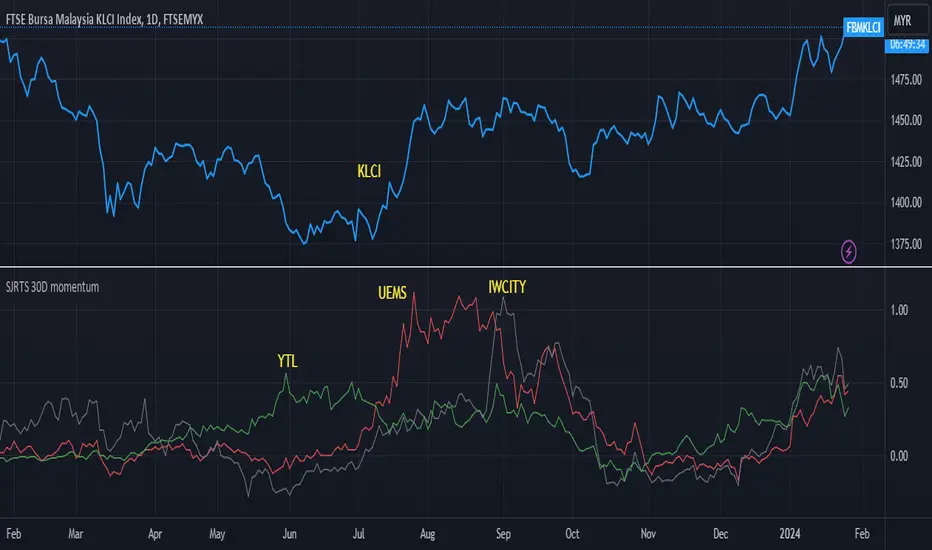
RTS linked stock indicatorThe Johor Bahru–Singapore Rapid Transit System (RTS) Link is an international cross-border rapid transit system that will connect Malaysia's second largest city, Johor Bahru and Woodlands, Singapore, crossing the Strait of Johor. It will consist of two stations, with the Malaysian terminus at Bukit Chagar station and the Singaporean terminus at Woodlands North station, which also interchanges with Singapore's Thomson–East Coast MRT line. (source: Wikipedia)
KLSE is looking bullish.KLSE is in the nice ascending channel. From the current position the index might push down a bit to 1460 before making a push higher into 1500 area.

KLSEOpportunity for KLSE. >> TAYOR
* Waiting this breakout guys, good opportunity for KLSE. Keep Watching Together, Rise Together.
Risk Factors:
1. Market conditions, unexpected news, or external events could impact the trade.
2. Always use risk management strategies to protect your capital.

Honeymoon over, FBMKLCI looks to continue the downtrend for nowSince the index failed to break the 1900 barrier and formed the double top in 2014 & 2018, it has been down ever since.
Though the index managed to recover from sharp drop during the COVID-19 pandemic, it remains below the 200 moving average.
Expecting it to retest the downtrend line in the second half of the year.
Government looks more stable now but honeymoon time is over.
Budget 2023 tabled today was not so enticing so it seems the only way is down for now.
Poor index performance makes momentum trading more challenging.
Just reminding myself to be more selective and conservative in the coming weeks to months.

What will happen to KLCI after State Elections? Currently KLCI hoover around strong Resistance at 1460 and we can see the double top potential on the chart. The MACD indicator also showing weakness by developing the bearish divergence pattern. Current support is at 1450 level and if this support broken, next support will be at the strong support 1437 and 1432.68. KLCI must defend this support in order to continue the bullish movement.
(Disclaimer : Personal analysis and for educational purpose only)

Is Malaysian market going to the NEW HIGH...?It's not financial advice, be wise when you trade, and take note this analysis for long term investments.
Everything was explained on the chart.
GOOD LUCK


Lets Hope FBMKLCI Visit 2008 LevelThe 1997–98 Asian financial crisis began in Thailand and then quickly spread to neighbouring economies. It began as a currency crisis when Bangkok unpegged the Thai baht from the U.S. dollar, setting off a series of currency devaluations and massive flights of capital.
The 2008 sub prime crisis-The decline in overall economic activity was modest at first, but it steepened sharply in the fall of 2008 as stresses in financial markets reached their climax. From peak to trough, US gross domestic product fell by 4.3 percent, making this the deepest recession since World War II. Housing prices increased, then fell, due to the subprime mortgage crisis. Banks went into crisis. The stock market plummeted, erasing wealth.
2023?

KLCI. Waiting for re-budgeting. 22/Feb/23.Long KLCI @ 1408 +/- on around March/April. Probably last “chance” to “accumulate” blue “cheap/chips” stocks! But probably not Banking Stocks.

FBMKLCI 2023 OverviewThe S&P500 rose after the release of minutes from the Federal Reserve's most recent meeting, which revealed members were laser-focused on managing inflation even as they decided to delay their rate hike pace. Officials at the Fed's policy meeting on 2022 December 13-14 agreed that the US central bank should continue to raise the cost of credit to restrict the rate of price increases, but in a gradual manner to reduce the risks to economic development. Investors were pouring into the Fed's internal debates for hints about the central bank's future course. Following the meeting, Fed Chair Jerome Powell stated that additional raises were required, striking a more hawkish tone than markets had anticipated.
My POV on KLCI could traded as low as 1000.00. International trade could affected from strengthening in USD currency whereby hawkish in import/export prices.

FBMKLCI Simple Chart AnalysisKLCI - Possible a rounding bottom to be form under the administration of new Government which led by unity government.
How to view the guidance via chart ( Refer back to pin message guidance if to trade )
Red Line = Support
Blue Line = Resistance
Light Blue = bullish/bearish pattern
Arrow = Double/Trip top/bottom
Red Chip = $$
Green Chip = XX

KLCI with new PM/Gov. 25/Nov/22For Studies Purpose ONLY. Malaysian have just voted and celebrated for their new government with its stock index surging >5%..BUT it probably need “some time” to “reformatting” the “bad hardisk’s sector” left by previous....

FBMKLCI - Breaks below the NecklineComment :
1) FBMKLCI has fell below Neckline A on 19-Sept, the prior short term rebound is likely over. The next supporting/rebounce point is expected to be around 1402. The bearish trend underway since 19-Aug. Please take cautious in your trading plan at the moment as the market could be getting more fluctuate.
2) TrendX+ indicator - red candlestick still moving below trend line, mid-term downtrend.
3) DDX+ indicator - bear signal on 19-Aug still valid.
4) MCDX+ indicator - banker bar (red) is absent, while retailer bar possess more than 80%.
Support & Resistance :
R : 1402 +/-
Remark :
Length of ab=cd
DISCLAIMER :
Analysis above SOLELY for case study purpose, not a PROFESSIONAL ADVISE. This analysis does not provide any trading advise and buy or sell. Trade at your own risk. Trade only after you have acknowledged and accepted the risks involved.

KLCIFrom my point of view, this index shows a possible bullish movement as the price already test the bearish trendline for the third times. Its mean that resistance trendline might become weak. Futhermore, price also did a breakout from previous high or resistance and on it way to resistance become support area. Malaysia general election also in near time and surely it will affect stock market. It is because the candidate or parties will give 'gula-gula' which is to good to be true manifiesto in order the citizens vote them in upcoming election. The budget 2023 announcement also can affect this index as the budget been postponed due to parliament collapse. US index also in recovery mode from their lowest before this. Rip my english hahaha

FBM KLCI Weekly TimeframeBuying Opportunity of Lifetime.
- August 1998
- End of 2008 to early of 2009
- March 2020
- October 2022
Simple strategy - buy blue-chip/component of KLCI when the price on lower channel.
Profiting way - Capital appreciation and Dividend given.

KLCI possible “bottom” @ around 1320 by end 2022. 13/Oct/22FMBKLCI’s “seem” like forming a triangle pattern in supercycle wave (b) (yellow). Price seem like contracting before “exploring” to upside “ONLY” after 2027..P/s.. it seem like most Index. E.g US, Asian point to year 2025, 2035..
