CESC = CLASSYIncorporated in 1978, CESC Ltd is in the business of generation and distribution of Electricity
What a classy setup for the Bull run ahead
CESC trade ideas

CESC - BREAKOUT STOCK TO BUY FOR SWING TRADINGSUPPLY ZONE & BREAKOUT STOCK
Breakout point - 150
ENTRY - 150
SL - 140
TARGETS - 180
Disclaimer - All information on this page is for educational purposes only,
we are not SEBI Registered, Please consult a SEBI registered financial advisor for your financial matters before investing And taking any decision. We are not responsible for any profit/loss you made.

CESC bullish; above 144 ? - Monday 22-Apr.The above information does not constitute investment/trading recommendation and it is purely for educational purpose. Please check the Strategy below...
SWING Trading Strategy:
Position is created, only upon stock closing above the entry price on day closing basis and is held on for 5-10 trading sessions for larger gains (5-10%)
INTRADAY Trading Strategy:
1) Impulse upmove stage: The strong upmove (nearly upto 2% from breakoutprice) happens within five to 15 minutes. "High Risk Traders" buy in hope of another 2% upmove intraday.
"High Risk Traders" patiently wait through the Pullback-Consolidation stage to realize profits. High risk/High reward set up as breakouts may fakeout (reversal)also
2) Pullback-Consolidation stage: After the above "Impulse upmove stage"; the price may then pull back and move sideways (between "Open" price and "High" of the above "Impulse upmove stage").
Safe traders with minimum risk profile wait for a breakout from the consolidation to enter at this stage to relize high profits in the final intraday final "Breakout continuation" stage
3) Breakout continuation: Stocks often in the third stage breaks up above the "High" of the first "Impulse upmove stage" and continue to go higher again.
Both Safe Traders/High Risk Traders book profits at this stage
This do not constitute, financial, investment, trading, or other types of advice or recommendation.

CESCCESC shows good relative strength in this type of stock. I am willing to take a big position with a small stop loss

CESC HEADING TOWARDS 154 ??cess is in tight range after a uptrend
stock is in good volume collection and getting it self ready for next move towards the 154 levels which is 13-14% from current levels
retest zone marked and all target and levels also on chart

CESC BREAK OUTCESC Channel break out@117. Multi year break out seen recently. Power stocks are also buzzing.

CESCClean breakout in #CESC, Traders should look for long opportunities in the stock. Investors can add the stock at multiple entry levels.
S1- 102
S2- 95
S3- 92
Below 92, investors should look to exit the stock and book Loss!

CESC WEEKLY CHARTCESC WEEKLY CHART
Cmp 96.10 Breakout @ 95 Support @ 80 Target @ 126
This stock has witnessed a swing breakout @ 95 levels, as marked by ellipse.Target projected is placed @ 126 levels.
Its only an observation & not any suggestion.

CESC 250 Bullish multiple chart patternCESC 250 ++ Bullish multiple chart pattern
1) long term bullish pennant chart pattern they are up side chart moving target 450 to 500.
1) short term they are cup and Handel bullish chart pattern the are 250 target
the are technical analysis for the according to chart pattern
but other one is fundamental are very strong because a power sector a very very bullish in till 2030 to good investment opportunity

CESC : Weekly channel breakoutNSE:CESC Weekly bullish breakout with positive price action and upside momentum.

CESC looks bullishCESC popped up on 52-week breakout screener results
A few highlights
Increasing volume when approaching the neckline level 94
Decreasing volume while getting corrected
Hugh volume during breakout neckline
Trading at its all-time high 102 levels
There is no resistance if it breaks its all-time high
RSI above 60 on a monthly, weekly and daily time frame
Even if we set stop loss below the previous swing low, we can comfortably achieve a risk-to-reward ratio of over two. Good trade for a swing or short-term.
If the trend continues after retesting the neck level of 94, we may see 125 levels shortly. The depth of the cup is the target from the neckline.

CESC buy above 98Cup pattern brrakout
High volume on breakout
RSI shows strength and crossed 60
Stock is ready to break 52 week high
Target upside min. 30%
SL weekly breakout candle low or 8% whichever is close.

CESC Ltd on Weekly TimeframePrice is moving in the same area from two years.
There's a strong resistance level in the range 91 - 96.
There's a possibility that price breaks this level in coming weeks , we can see volume is increasing.
Also price is above 200 EMA.
Don't haste wait for the breakout with big green candle .
FUNDAMENTALS :-
Pb ratio :- 1.05
Fy PE ratio :- 8.88
Revenue increasing in past three years.

CESC READY TO BREAK TRENDLYNE RESIST Ready to breakout the trendline and multiple resistance on monthly chart

Round Bottom Breakout (WEEKLY TF) - CESCPlease look into the chart for a detailed understanding.
Consider these for short-term & swing trades with 4% profit (In my observation, I found that most of the stocks reached 3% to 4% on weekly basis)
Please consider these ideas for educational purposes.

Needs to come out of ChannelWeekly chart analysis, needs to come out of channel. Bottom and tops are good point for entry and exit respectively.

cesc 1w time frame buy @ 74.90 target @ 82.50 , 84.50, 86.40 cesc 1w time frame buy @ 74.90 target @ 82.50 , 84.50, 86.40
triangle breakout
risk reward 1.5
its just a view trade at your own risk
sl@67.15

CESC is ready to breakout channel patternNSE:CESC is ready to break channel pattern in upside.
Technically volume levels are good as up move is with high volume and down move is with less volume.
Financials too looks good.
Key note : Always follow proper risk management to avoid losing capital from false breakouts as this is common.
Caution : This is a knowledge sharing analysis, not a call.
Profits are not made from following ideas, but by following Risk Management .


CESC - Range bound in 65-95 for 15 monthsThis was after being up 3x from 20-65 in Jan-2021
Plan ahead, consider to Buy above 85
- and/ or Rejections near 65 or 50
PB 1x
PE 7x
DE 1.5
ROCE 11%
DivY 6%

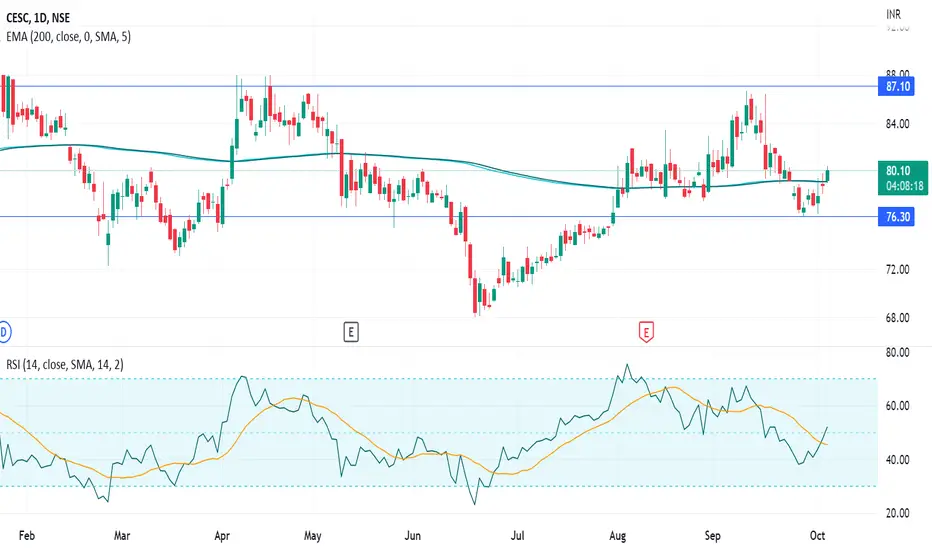
CESCI bought CESC
1. Candle breaching 200 EMA
2. RSI has a bullish crossover
SL 75 for T1 85 & T2 95
Positional trades
Trend Following SystemIt's a simple bearish trend following system, going to meet with its supportive zone. "1Day" time fram is used here.
#trading #systemtrading #trendfollowing #tradingforlife
