NUE trade ideas
NUE Entry, Volume, Target, StopEntry: with price at or slightly above 174.74
Volume: with volume greater than 1.47M
Target: 408.78 area (this is an area, no guarantee it reaches this price, but you should be selling on the way up)
Stop: Depending on your risk tolerance; Based on an entry of 174.74 & target of 208.02, a stop at 163.65 gets you 2/1 Reward to Risk Ratio.
This LONG swing trade idea is not trade advice and is strictly based on my ideas and technical analysis. No due diligence or fundamental analysis was performed while evaluating this trade idea. Do not take this trade based on my idea, do not follow anyone blindly, do your own analysis and due diligence. I am not a professional trader.

Nucor repping a big bull flag on larger time frameWe'll have to see how it plays out but with great momentum and with a good fundamental analysis, could see Nucor perform its way out of this bull pattern to a nice target.

NUE - Bull StructureA bull structure dominant above the slight up channel in grey
I expect a breakout from this structure bullishly
If no breakout then a retest of the up channel in grey is fine
Daily chart

Short Term Wheel Trade on NUEAnother successful Wheel Trade on NUE:
Tradingplan á la Rockwell Trading:
Look for stock that is lower than yesterday
Check the chart for a support level
Check the fundamentals of the underlying
Check correlation to your portfolio
Don't be scared if you get the stock assigned
Calculate the strike for a decent annualized ROI
Trade ENTRY:
Entry: 2023-05-24 09:52
Total premium netto: $ 118,64
Contracts: 3
Type: Short Put
Strike: 129
Expiry: 2023-05-26
Trade EXIT:
2023-05-26 16:20
Expired worthless
ann. ROI: 118,64 / ( 129 * 300 ) * 365 / 2 = 55,94%

Nucor in decline or consolidationThis one is a bit messy with all the trendlines and auto fib retracement tool, so bear with me. NYSE:NUE still looks like it's in an overall decline. The three blue arcs appear to be a head and shoulders pattern. Meanwhile, in the short term there was a wedge pattern that developed in late April and instead of the daily support holding in broke on 4.25 and hasn't recovered since. The momentum of the declination appears to be slowing, so we could see an extended consolidation phase instead of greater declines.

$NUE Head & Shoulders Pattern NYSE:NUE Head & Shoulders Pattern triggered, looking for this stock to head toward a double bottom

NUE - Steel StockAnother pattern that is closely on watch for a trigger.
A break of this neckline does not bode well for this company
As of now Nuecor is holding on

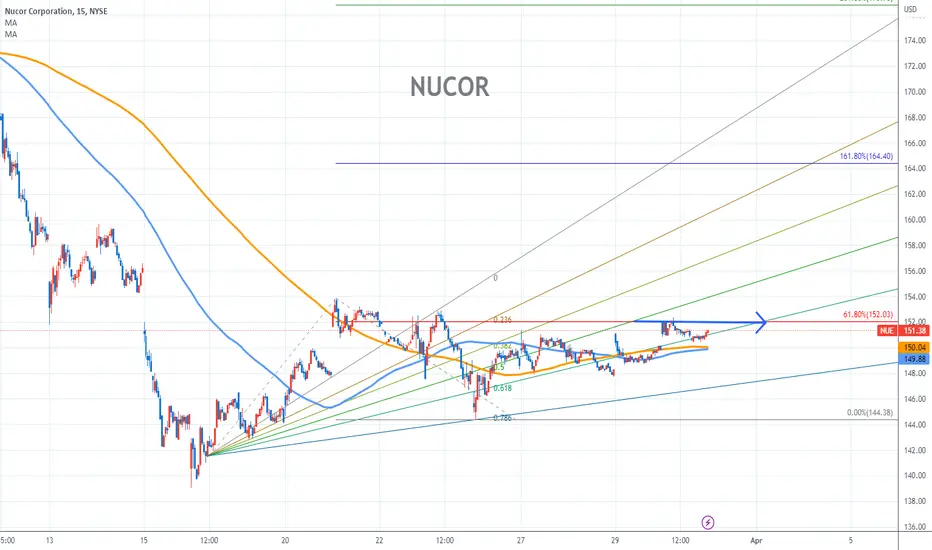
NUCOR Stock Chart Fibonacci Analysis 033023Trading Idea
1) Find a FIBO slingshot
2) Check FIBO 61.80% level
3) Entry Point > 152/61.80%
$NUE - Long Trade IdeaThis ticker popped up on my screener set based on strength.
As long price is above the downtrend formed with symmetrical triangle, target is $300.
Noticeable pattern: symmetrical tri

$NUE Daily chart looking good for a swing trade It bounced off the 200 day MA and now in a 2-2 continuation.
Looks like it wants that gap fill up to the $156.24 PL.
Currently inside on the week and at the bottom of uptrend.
ATR is $6.20
I like the $155C 3/24 avg 1.10
This isn't trading advice for educational purposes only. Please do your own due diligence.


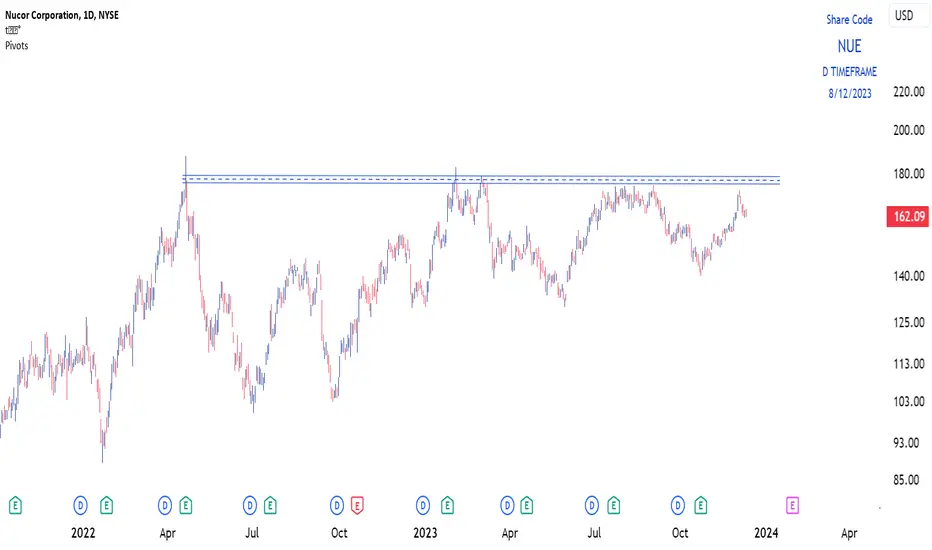
Nucor Could Be Inching Toward a BreakoutMetal stocks have fought higher all quarter, and now a key steelmaker may be attempting a breakout: Nucor.
The first pattern on today’s chart is the series of higher lows since late last month. NUE was stuck below $137 (the close of on October 26) for several weeks, which produced an ascending triangle. But prices broke out on November 10.
Second is the summer peak around $146. The stock is approaching that level. A close above it could draw some buyers from the sidelines.
Third, the recent consolidation took place above the 200-day simple moving average (SMA). That may suggest its longer-term trend is bullish.
Speaking of longer-term trends, notice the higher lows in July and September versus January.
Finally, MACD has been positive almost all quarter.
TradeStation has, for decades, advanced the trading industry, providing access to stocks, options, futures and cryptocurrencies. See our Overview for more.
Important Information
TradeStation Securities, Inc., TradeStation Crypto, Inc., and TradeStation Technologies, Inc. are each wholly owned subsidiaries of TradeStation Group, Inc., all operating, and providing products and services, under the TradeStation brand and trademark. You Can Trade, Inc. is also a wholly owned subsidiary of TradeStation Group, Inc., operating under its own brand and trademarks. TradeStation Crypto, Inc. offers to self-directed investors and traders cryptocurrency brokerage services. It is neither licensed with the SEC or the CFTC nor is it a Member of NFA. When applying for, or purchasing, accounts, subscriptions, products, and services, it is important that you know which company you will be dealing with. Please click here for further important information explaining what this means.
This content is for informational and educational purposes only. This is not a recommendation regarding any investment or investment strategy. Any opinions expressed herein are those of the author and do not represent the views or opinions of TradeStation or any of its affiliates.
Investing involves risks. Past performance, whether actual or indicated by historical tests of strategies, is no guarantee of future performance or success. There is a possibility that you may sustain a loss equal to or greater than your entire investment regardless of which asset class you trade (equities, options, futures, or digital assets); therefore, you should not invest or risk money that you cannot afford to lose. Before trading any asset class, first read the relevant risk disclosure statements on the Important Documents page, found here: www.tradestation.com .


$NUE with a Bullish outlook following its earnings #Stocks The PEAD projected a Bullish outlook for $NUE after a Negative over reaction following its earnings release placing the stock in drift C with an expected accuracy of 80%.

orderflow war warningsaccording orderlfow steel will go up and because of war warnings steel have to go up

Ugly Top (s)Multiple tops with a recent Triple Top.
Price is still above the Neckline which is strong support until broken. The neckline is usually drawn where the shoulders touch down before price goes up once again so the neckline has served as support on multiple occasions for NUE.
Pattern valid with a break of the neckline and a confirmed downtrend. Some wait for the retest of the neckline as it is often retested after being broken.
No recommendation.
Short interest is around 3.25%. Short with a break of the neckline and a confirmed downtrend.
No recommendation.

9/11/22 NUENucor Corporation ( NYSE:NUE )
Sector: Non-Energy Minerals (Steel)
Market Capitalization: 37.582B
Current Price: $143.56
Breakout price: $144.60
Buy Zone (Top/Bottom Range): $142.30-$134.95
Price Target: $152.50-$154.60
Estimated Duration to Target: 18-20d
Contract of Interest: $NUE 10/21/22 145c
Trade price as of publish date: $7.65/contract

$NUE with a Bullish outlook following its earnings #Stocks The PEAD projected a Bullish outlook for $NUE after a Positive over reaction following its earnings release placing the stock in drift C with an expected accuracy of 37.5%.

NUE - Steel heating up.....againSteel and materials sector heating up again. Pullbacks light on volume and constructive. Cup with no handle breakout?
You don't need to know what's going to happen next to make money ~Mark Douglas
Lose like a pro and keep trading, or lose like a novice and quit ~Mark Ritchie

$NUE D$NUE D , sharp falling wedge. If get a breakout target around 157 for measured move. I have level below if break that then flip short since pattern fail then. Can play X since both steel companies move similarly.

Log scale - useful tipchart on the left - log scale.
You may clearly see why it is useful to check while analysing longer-term frames.
Ideal trend line reaction. as opposed to usual chart

Head and shoulders bear flag Short $NueNucor was driving me nuts the last 3 months constantly setting all time highs (while the rest of the market bled out) when their last earnings had lowered guidance that would have crashed any other stock.
Twice at new records I bought puts, but chickened out and sold early for losses when they kept rebounding back to new highs again. Anyways I saw the same options today worth a couple grand more than i sold for, and that’s with theta decay of short dated options. So I did some TA and belief the risk reward is still worth buying puts or shorting, especially if you catch it when it’s going up.
So anyways, from a TA standpoint they are a little overextended and just finished an a 12345 motive wave and an ABC corrective wave pattern so the first couple leges could be choppy before the next drop, but it’s coming. The target of the bear flag was roughly the same as the head and shoulders:
Analysts give it a fair price of $60, I have it crashing to $95 minimum(the measured target). Hopefully it goes further. Got myself some puts one more time, and as usual they are starting off up.
I’m not going to paper hand this time. I believe in the TA. I respect the patterns. I trust the fundamentals will bring the price where it belongs.
