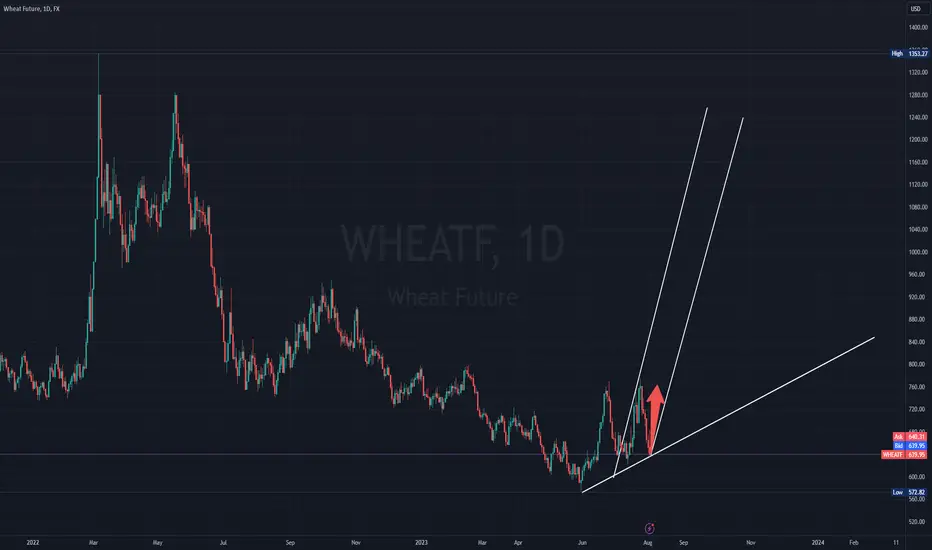
Wheat looks good for a long ride to the upsideThe prices are at the lows and the structure shows a rejection at low prices and, it´s ready to launch the price to the upside and recover part of its year looses. Good luck!
WHEATUSD trade ideas

WHEAT, start planting now for a MASSIVE HARVEST...WHEAT: BOUNTIFUL HARVEST SOON... if you seed at the current price range.
KEY NOTES:
WEEKLY DESCENDING TRENDLINE BREAKOUT.
Monthly shifting price lines. HUGE HINT!
Weekly histogram higher lows.
MONTHLY HISTOGRAM SHIFT -- CLOSING UP TO BREAK SOON.
SEEDED LONG (long term) 628.0
TAYOR.
Safeguard capital always.
-----------------
RELATED NEWS:
WSJ ARTICLE:
Severe Drought Stunts Great Plains Wheat Crops
Harvest in nation’s breadbasket forecast to be the worst in 60-plus years
June 17, 2023 10:09 am ET

Wheat: double-top then back to fundamentals or La Nina concerns?Wheat has completed five Elliot waves up and with bearish fundamentals on the ground remaining, an ABC correction may now be in order.
If the rally has in fact exhausted itself, then a double-top which has often followed wheat rallies would not be unusual here. The conditions for another bounce off shorter time frame averages to yesterday's highs to form that double-top appear to be in play.
However, if La Nina worries persist, then the market may stabilize as it meets the rising 20 day MA and new highs could be in play. The Golden Cross about to be formed by the daily 50MA crossing up over the 200MA would give these climate/weather concerns form.
Not financial advice and you trade at your own risk.

WheatUSD Oanda Buying Breakout Trend ContinuesRealising my folly from my previous trade, I recognised my faults.
Recap -
1st - I traded with the Higher Time Frame and Entry Time Frame Trends, but I am actually entering on a opposing trend against the Lower Time Frame, and that is why the price never move in my intended direction after hours.
The opposing trend movement is also a sign that price is tanking, and that the Big Boys might not be into this product anymore.
2nd - Trade Breakout Trends was my thang. But I subconsciously/consciously shifted my setups to Trend Following which is to buy high and sell higher. Low winrate, needs to gather a ton of trades before the results show, stressful way to trade. I recognised my fault and now I shifted myself back to Breakout Trends.
I would like to add on also that, I would see this as a price game instead of a time frame game. But I also recognise that 50/60MA on the 15Minutes Time Frame is very powerful, and I called it Duck Hunting and I would be hunting ducks again, on the 15 Minutes Time Frame.
Would I trade on the 4H Time Frame or the Hourly? It's a price game so as long as the price is right, and it aligns with my point 1 and 2, I would.
2019SGT
22052024

Wheat: Megaphone down wave vs impending Golden CrossOn wheat's daily chart, the rally appears to have completed 5 Elliot waves up. Bearish fundamentals of current ample supply may now play out in an ABC correction, though how deep with a La Nina expected to affect Russia it remains to be seen.
Beyond an ABC correction, it's possible to consider that said bearish fundamentals may see an impulse all the way down to the lower megaphone structure line. The problem with this scenario is the time it would take to get down there. If La Nina is to play a part this Northern hemisphere growing season, then it's affects on the market will be felt sooner.
The probability a drop that significant may be further weakened by the impending Golden Cross of the daily 50MA crossing up over the 200MA. TA indicators like this may not yet reflect bearish current fundamentals of supply, but make sense in terms of the pricing in of a La Nina event.
Not financial advice; trade at your own risk.

Wheat in Elliot Waves pt.2: Fifth wave completed?Wheat saw another bullish end to the week after a favorable USDA report.
In the last post, we looked in TA terms at whether the current rally's first impulse occurred in March or on April 19th. The latter (in pink numbers) seems to have been the case as we saw the 5th wave up to near the 2.618 Fib. If this analysis continues to hold true, TA wise an ABC correction down may soon occur. This correction should also reflect the current supply side bearish fundamentals of the grain and it will be interesting to see how deep it goes. However, if the ABC down is somewhat shallow, this could suggest the continued accumulation of a bullish trend, with adverse weather and or climate anomalies the main concern going forwards.
Another reason to suspect this coming correction may be shallow is the now imminent Golden Cross of the daily 50MA in orange and 200MA in white. While events like the crossing of moving averages are not certain things, they do indicate trend direction and are worth considering here. Remember though, that supply fundamentals remain currently bearish and a correction will have to reflect that at some stage.
In terms of those weather/climate concerns, market analysts (link below) have identified that the expected return of the La Nina weather system in the coming months historically means drought in Russia, the largest producer. This in turn may significantly reduce yield in Russia and affect global prices. This demonstrates the fickle and thus volatile nature of grains, as the same analysts were pointing out in early March how Russian oversupply, some of it stolen from Ukraine, was continuing to strangle the market. Furthermore, it should not be forgotten that this will be a climate change La Nina, meaning it may prove unpredictable and thus volatile on markets.
www.grainbrokers.com.au
Not financial advice and you trade at your own risk.

Wheat in Elliot Waves: rally's first impulse?Wheat has rallied since April 19 due to short covering and various weather concerns, and various analysts expect the grain to return sooner or later to the fundamentals ample supply.
From an Elliot Waves perspective on a daily chart, it's possible to see a 5 wave structure marked in yellow 1-5. However, while the rally proper began on April 19, it's not completely clear whether that first major impulse was actually wave 3 (yellow), with wave 1 starting on March 8. If that's the case, then recent highs complete the 5th wave and we can now expect a B and C wave down. But if April 19th actually marked the first wave, then TA-wise there may yet be another impulse up for wave 5. In this scenario, the 2.618 Fib may become the next resistance.
As fickle weather has largely been responsible for the rally, it's worth considering that an actual crop-affecting climate anomaly in the coming months due to increasingly volatile climate change may not yet be priced in.
Not financial advise of any kind and you trade at own risk.

WHEAT - Bottom is near!After a failed rally, it fell down the break the last low and is now grinding out a bottom. This looks like a good opportunity to long by buying small positions every week for next few months.
There has also been a completion of a three-wave correction, which helps to further strengthen the case that this could be in the final bear stage.

Wheat is trading in a falling wedge!Weekly chart, wheat cash contract is trading in a falling wedge!
Will we see the 435 - 400 price level or rebound upwards from 520 - 525?
It is tough to confirm.. However, this falling wedge pattern has a higher probability that the price will cross the resistance (line R) upwards towards 745 and 765 in the long term.
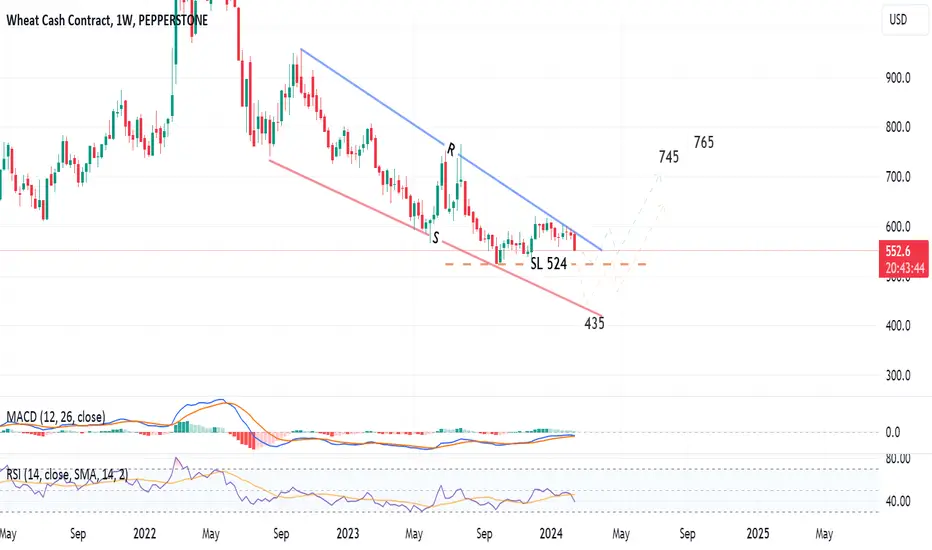
We are observing a potential "breakout" pattern.
The price has broken through the downward trendline, which is drawn by connecting the lower highs on the price bars. The breakout indicates a possible end to the downward trend and may suggest a change in momentum.

Another Pairs that is Very Good Set Up Entry .Wheat is a coming 2 or 3 months , Bull Market Soon, Risk & Reward Ratio VeryNice . But Please Not that Your Money Management System .

Live swing trade in wheatLive swing trade in wheat. I am very curious about the result because it is December 1 and exactly at this time the seasonal tendency is to have a strong fall in the first days of December, after which the rest of the month is bullish. My curiosity is if this crash will not happen again due to technical reasons.

WHEATF | Wheat Poised for a Rebound!👋 Good day, traders!
📈 After a two-month decline on the D1 chart, WHEATF has found support at the 540 level. Given its month-long accumulation phase and the completion of its downtrend, a breakout above the 587.75 resistance level could signal a rally towards target levels of 615.00, 660.00, 695.00, and 732.00. Consider buying entries around the 595.00-600.00 range, targeting potential profits of 3.3% to 23.0%, with a SL set at ~565.00.
✅ Give a 👍 if you're keen on more insightful and profitable trading ideas❗️
❓ I'd love to hear your thoughts. What's your take on this?
DISCLAIMER:
This idea is purely informational and educational. It's not a trading recommendation. Each trader should analyze and make decisions based on this information independently.

Wheat middle term.Rsi bullish divergence.
Far away from ema200, soon this average will pull the prices towards itself.
* What i share here is not an investment advice. Please do your own research before investing in any asset.
* Never take my personal opinions as investment advice, you may lose all your money.

Wheat - H4 - TriggerWhenever the price breaks the downward trend line , there is a strong possibility for wheat to rise to the 650$

Wheat - D1the price 570$ is the last support area for the Wheat
Wheat is moving in a channel and if it reverse from this area it can rise to the 650$ .
Trigger is in the H4 time frame whenever price breaks the downward trend line.

Wheat - H4 - LongWheat is a commodity and seasons affect the wheat price.
in August wheat usually drops to the lower prices.
Now, due to the supply problems and by looking at the chart , if it is below 650$ you can buy and keep it until 685$.

The end of the wheat harvest season. start of traders' harvestBased on fundamental data (end of the harvest season). We have to see higher prices on Weat soon.
Also if we look at it based on technical analysis, the price has a really important support.
I'm entering a LONG position on Weat.

Wheat Future - ShortDespite the news from Ukraine about missile strikes on the grain export ports. We have to take into consideration the top 5 exporters of wheat in the world.
1. Russia
2. United States
3. Australia
4. Canada
5. Ukraine
This indicates that there is still competition for the top exporters. It will be in Russia's best interest to sell as much wheat at the lowest price to other countries. This would allow a bigger control of the market, despite "ethically" sourcing.
Worth noting that just went through a double top scenario and in a "testing" phase. A price drop is expected.
Lastly, for what it's worth, harvesting season is about to start in September, sending more grain to the market, while further driving the price down.

WheatI think wheat is about to bounce up, we have double Bullish Regular DIV, we get in to resistance area which make that more possible.

WHEAT BULLISH SCENARIONKyiv's goal is to establish direct access for international ships to their Ukrainian seaports for loading grain. However, Russia has reacted strongly to this development, stating that ships heading to Ukrainian seaports may be treated as potential military targets.
The consequences of these actions by Russia have not only affected Ukraine but have also raised concerns globally. The United Nations has warned of a potential food crisis in the world's poorest countries due to Russia's decision to abandon the grain deal, which was brokered by the U.N. and Turkey.
Ukrainian officials claim that since Russia's departure from the grain deal, they have targeted 26 port facilities, five civilian vessels, and approximately 180,000 tonnes of grain in a series of strikes over nine days.
Risk Disclosure: Trading Foreign Exchange (Forex) and Contracts of Difference (CFD's) carries a high level of risk. By registering and signing up, any client affirms their understanding of their own personal accountability for all transactions performed within their account and recognizes the risks associated with trading on such markets and on such sites. Furthermore, one understands that the company carries zero influence over transactions, markets, and trading signals, therefore, cannot be held liable nor guarantee any profits or losses.
Wheat creates an almost perfect cupNext target is 798 if wheat breaks the current resistance.
Two scenarios, either break the resistance or bounce down to create a cup & handle then break resistance.
All indicators imply a move up!

WHEATUSD: Hidden Bullish Divergence at Previous Support LevelWheat first went up after a long period of preparation to hit and complete a Bullish .886 Harmonic BAMM before then coming back down, and now it looks like it wants to bounce back up from the same area due to there being Monthly Hidden Bullish Divergence at the Previous area of Support, though this time I will be targeting a relatively lower high such as the .786 retrace.
