On AMC: 4-hour Chart AnalysisAfter observing the bear channel, a measured move of 4.03 has been identified.
Key observations:
Support coincides with EMA 50 at 4.03.
Fibonacci retracement indicates support at 0.786 (4.03), a FIB historically favored by AMC.
A notable bounce occurred at 4.00 during after-hours trading.
Bullish:
Next report date
—
Report period
—
EPS estimate
—
Revenue estimate
—
−1.2300EUR
−359.32 MEUR
4.36 BEUR
294.59 M
About AMC Entertainment
Sector
Industry
CEO
Adam M. Aron
Website
Headquarters
Leawood
Employees (FY)
33.81 K
Founded
1920
FIGI
BBG005QR91V4
AMC Entertainment Holdings, Inc. engages in the theatrical exhibition business through its subsidiaries. It operates through the U.S. Markets and International Markets segments. The U.S. Markets segment is involved in owning, leasing, or operating theaters and screens in the U.S. The International Markets segment focuses on owning, leasing, or operating theaters and screens in the United Kingdom, Germany, Spain, Italy, Ireland, Portugal, Sweden, Finland, Norway, Denmark, and Saudi Arabia. The company was founded by Barney Dubinsky, Maurice Durwood and Edward Durwood in 1920 and is headquartered in Leawood, KS.

Dont Say I Didnt Tell YouAMC will follow GME, if you look at the larger time frame it is setting up a LARGE move.
Its exhausted to the down side, taking profit at 50% stock gain. wont do options.

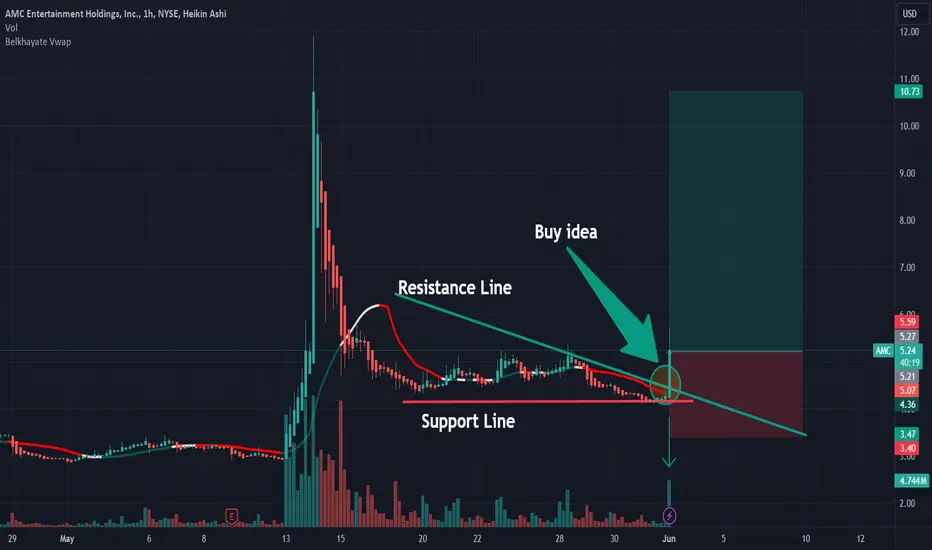
AMC: Buy idea Buy idea on AMC as you see on the chart after the breakout with force the vwap and the resistance line by a big green candle follow by a large green volume.!
AMC Possible price action
******* NFA **********
******Educational purposes only*******
AMC could see another short squeeze rally in few couple months
The chart completed A non-failure Swing

AMC, series of price growth expected.AMC is registering significant net buying at the current levels -- conveying accumulation for a higher valuation.
On the 4h data, 3rd higher lows was created suggesting upside continuation.
Volume has also also steadily increased this past few days.
Spotted at 5.0
TAYOR
Safeguard capital always.

AMC pumps price and volume into fair value zone LONGAMC is on a 4H chart with a set of VWAP bands overlaid In the past two trading sessions price
and volume have pumps and so also the PV Trend indicator. There is no fundamental
footprint on this move. it is a pure meme much like a similar move of GME. I will go long
here hoping to ride the mo

AMC - Signs of Life 👨⚕️Now that the AMC hype train has died down, I can start positioning on some lower risk trades. Been waiting to see this pop.
As long as we dont gap up on open, I'll be taking some here at the 618 - tight stop. If stopped out, will look for rebuys near pivot high. Any break of that and Im out.
Simpl

updated amc and gme targets.if we get our pump on tuesday, the targets change. be careful playing with memestocks.
gme $100 back to $6
amc $18.99 back to $1.30 range

Back testing AMCCurrent resistance levels match resistance and market levels in 2019 - 2020 prior to significant trading volatility.
In addition, trading volume is above 1.8B shares which is almost 8x the volume traded at the height of the meme trading frenzy.


See all ideas
Trade directly on the supercharts through our supported, fully-verified and user-reviewed brokers.


Curated watchlists where AH91 is featured.


Frequently Asked Questions
The current price of AH91 is 4.4525 EUR — it has decreased by 0.53% in the past 24 hours. Watch AMC ENTERTAINMENT HOLDINGS INC stock price performance more closely on the chart.
Depending on the exchange, the stock ticker may vary. For instance, on XETR exchange AMC ENTERTAINMENT HOLDINGS INC stocks are traded under the ticker AH91.
AH91 stock has fallen by 4.95% compared to the previous week, the month change is a 40.63% fall, over the last year AMC ENTERTAINMENT HOLDINGS INC has showed a 88.28% decrease.
We've gathered analysts' opinions on AMC ENTERTAINMENT HOLDINGS INC future price: according to them, AH91 price has a max estimate of 7.40 EUR and a min estimate of 2.96 EUR. Watch AH91 chart and read a more detailed AMC ENTERTAINMENT HOLDINGS INC stock forecast: see what analysts think of AMC ENTERTAINMENT HOLDINGS INC and suggest that you do with its stocks.
AH91 reached its all-time high on Jun 3, 2021 with the price of 345.7160 EUR, and its all-time low was 3.7700 EUR and was reached on May 31, 2024. View more price dynamics on AH91 chart.
See other stocks reaching their highest and lowest prices.
See other stocks reaching their highest and lowest prices.
AH91 stock is 6.65% volatile and has beta coefficient of 1.65. Track AMC ENTERTAINMENT HOLDINGS INC stock price on the chart and check out the list of the most volatile stocks — is AMC ENTERTAINMENT HOLDINGS INC there?
Today AMC ENTERTAINMENT HOLDINGS INC has the market capitalization of 1.31 B, it has decreased by 1.01% over the last week.
Yes, you can track AMC ENTERTAINMENT HOLDINGS INC financials in yearly and quarterly reports right on TradingView.
AMC ENTERTAINMENT HOLDINGS INC is going to release the next earnings report on Aug 8, 2024. Keep track of upcoming events with our Earnings Calendar.
AH91 earnings for the last quarter are −0.72 EUR per share, whereas the estimation was −0.70 EUR resulting in a −3.90% surprise. The estimated earnings for the next quarter are −0.27 EUR per share. See more details about AMC ENTERTAINMENT HOLDINGS INC earnings.
AMC ENTERTAINMENT HOLDINGS INC revenue for the last quarter amounts to 881.74 M EUR despite the estimated figure of 816.90 M EUR. In the next quarter revenue is expected to reach 1.05 B EUR.
AH91 net income for the last quarter is −151.53 M EUR, while the quarter before that showed −164.89 M EUR of net income which accounts for 8.11% change. Track more AMC ENTERTAINMENT HOLDINGS INC financial stats to get the full picture.
As of Jun 5, 2024, the company has 33.81 K employees. See our rating of the largest employees — is AMC ENTERTAINMENT HOLDINGS INC on this list?
EBITDA measures a company's operating performance, its growth signifies an improvement in the efficiency of a company. AMC ENTERTAINMENT HOLDINGS INC EBITDA is 358.48 M EUR, and current EBITDA margin is 8.30%. See more stats in AMC ENTERTAINMENT HOLDINGS INC financial statements.
Like other stocks, AH91 shares are traded on stock exchanges, e.g. Nasdaq, Nyse, Euronext, and the easiest way to buy them is through an online stock broker. To do this, you need to open an account and follow a broker's procedures, then start trading. You can trade AMC ENTERTAINMENT HOLDINGS INC stock right from TradingView charts — choose your broker and connect to your account.
Investing in stocks requires a comprehensive research: you should carefully study all the available data, e.g. company's financials, related news, and its technical analysis. So AMC ENTERTAINMENT HOLDINGS INC technincal analysis shows the sell today, and its 1 week rating is sell. Since market conditions are prone to changes, it's worth looking a bit further into the future — according to the 1 month rating AMC ENTERTAINMENT HOLDINGS INC stock shows the sell signal. See more of AMC ENTERTAINMENT HOLDINGS INC technicals for a more comprehensive analysis.
If you're still not sure, try looking for inspiration in our curated watchlists.
If you're still not sure, try looking for inspiration in our curated watchlists.