ZR/JPY LONG TRADE IDEASellers have been rejected on a daily low buyers are stepping in. switch to lower time frame and execute your long positions. hold till satisfied
ZARJPY trade ideas

ZARJPY: Symmetrical TriangleZARJPY is trading in symmetrical triangle, we can enter into the long trade after the break of HH.

ZARJPY - 4H - DOUBLE BOTTOMS - LONG POSITIONIn this chart we can spot Double bottoms on 4h chart.
we can expect a decent target to be fulfilled. we take entry after break of neckline.

ZARJPY - FALLING WEDGE.ZARJPY has formed Falling wedge pattern. Stop loss, Buy stop and TP'S have been marked.

ZARJPY what are thoughts this one....... HONG KONG (Reuters) -Asian shares were flat on Thursday with markets holding onto their gains for the week as confidence grows that interest rates globally will head lower next year, while oil prices fell on the prospects for smaller-than-expected output cuts by OPEC+.
Investors are also looking to Chinese policymakers for clues on possible support for the long-suffering property market, in line with broader growth targets they are hammering out.
MSCI's broadest index of Asia-Pacific shares outside Japan edged down 0.03% in thin trading, with Japan and the United States on holiday.
China's benchmark share index fell 0.16% on Thursday, with the real estate sub-index retrieved earlier losses to gain 2.11%.

ZARJPY Needs a PullbackTaking a look at ZARJPY in the H1 timeframe, I notice that it's currently at the (X-Y) leg, meeting the 50 EMA. However, it's important to note that the sequence isn't theoretically complete; - it reaches completeness at point Y.
What piques my interest is the possible completion of point (X). This could potentially signal a shift towards a bearish trend leading to point (Z). This is particularly significant because point (X) signifies the conclusion of an established bullish trend within the Elliot Wave sequence, considering the fib 1.1618.
The prevailing bias points towards 7.079 with a single price target, and when we consider the overall trend on the daily chart, it remains bullish, aligning with the 200 EMA.
K.
Strategy Concepts: ABC-D, 50 EMA & 200 EMA, Elliot Wave, SnR zones, AB = (CD * 1.1618)

ZARJPY: Massive Head and Shoulders with Bearish DivergenceIn addition to the Bearish 5-0 I pointed out before on a previous chart, the ZARJPY has also formed a Potential Bearish Head and Shoulders that is visible on timeframes even as high as the monthly with Bearish Divergence on the MACD and RSI. If The Carry Trade truly is to be dissolved, the ZARJPY should be among the currency pairs that are most severely affected, as it has the highest interest rate differential and therefore generates the highest yield for the time being.

ZARJPY: My Bearish Speculation Against The JPY Carry TradeWe have some Bearish Divergence on the ZARJPY, but the main reason I entered this trade was to speculate against the JPY Carry Trade and front-run the potential flight we may get back to the Yen if Japanese Yields were suddenly to go up or even become uncapped during the BoJ meeting tonight.
I could have shorted EURJPY, GBPJPY, AUDJPY, or USDJPY instead, but I feel ZARJPY may give a more violent reaction as it is a currency that has generated some of the highest yields vs the JPY thus far, and if that yield were threatened, I think it would move down quite fast compared to the other pairs.
I guess as a side note: This might end up being a Bearish 5-0 in the long run.

ZARJPY, Bearish Triangle-Formation, Declines Incoming!Hello,
Welcome to this analysis about ZARJPY, we are looking at the 4-hour timeframe perspectives. As when looking at my chart we can watch there how ZARJPY has developed this bearish wave-count to the downside and has now formed this bearish symmetrical-triangle-formation marked in my chart with the black boundaries. Within this formation, ZARJPY has the coherent wave-count almost already completed and has the 100-EMA as strong resistance. All these factors give the indication that the triangle-formation will complete in the next times bearishly to the downside, when this happens it will be the set-up for the bearish continuations to the downside and the activation of the main initial target-zone at the 7.45 level marked in my chart in blue. When this level is reached it has to be elevated how ZARJPY continues and if there comes a potential reversal or further heavy bearish declines will follow up.
In this manner, thank you for watching my analysis about ZARJPY and the bearish triangle-formation-breakout likely to come up in the next times with the targets to be activated, will be great when you support it with a like and follow or comment, great contentment for everybody supporting, all the best!
"The high destiny of the market is to explicate, rather than to speculate."
Information provided is only educational and should not be used to take action in the markets.

$ZARJPY: Uptrend in the weekly chartVery strong setup in this pair, aided by massive positive carry on the long side.
Low risk opportunity in the FX market.
Best of luck!
Cheers,
Ivan Labrie.

ZARJPY LONG MOVELooks like the pair is going long and expecting a pull-back soon, be on the lookout fellow traders✌️
True Beautywas running thru some pairs and I just came across this natural beauty #noexplantionneeded I love this.....

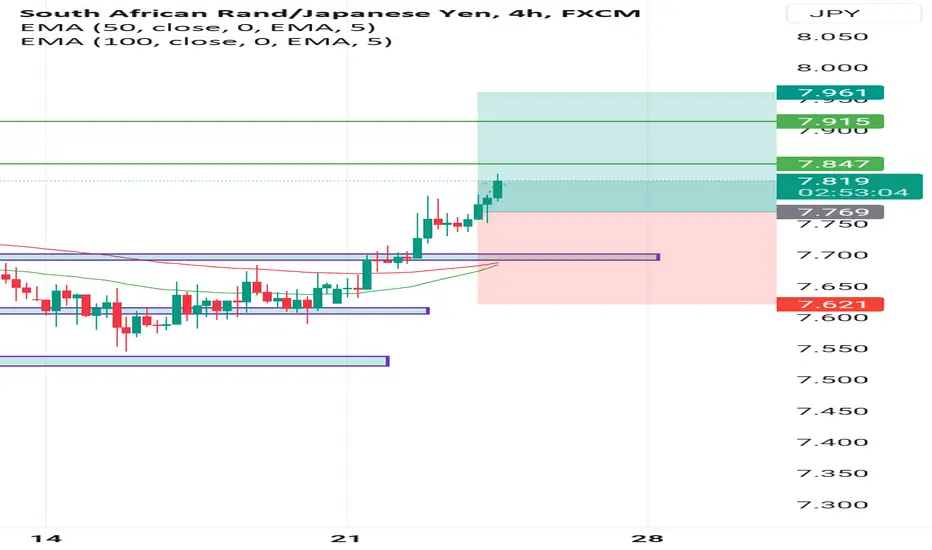
ZARJPY: Riding the Bullish Wave📈🚀 ZARJPY: Riding the Bullish Wave 🚀📈
📊 Technical Analysis: Get ready for a potentially bullish ride on the ZARJPY forex currency pair! 🌐📈 The 1-hour chart reveals a strong and clear bullish trend, supported by a bullish trend line. 📈📈 Additionally, the Momentum Indicator RSI shows no signs of divergence, indicating the continuation of the bullish momentum. 🚀💹
📝 Trade Plan:
🎯 Entry (Fib Retracement): 7.859
🛑 Stop Loss: 7.769
🎯 Take Profit (1:1 Risk-Reward Ratio): 7.949
📊 Rationale: The technical analysis points to an opportune moment to join the bullish trend on ZARJPY. By entering at 7.859, we aim to capitalize on the anticipated upward movement. A well-placed stop-loss at 7.769 ensures risk management and shields against unexpected market fluctuations.
🎯 Take Profit Target: Our take-profit level is set at 7.949, offering a 1:1 risk-reward ratio. This target aligns with a potential resistance area, where profit-taking is prudent.
📈 Trade Smart: As you prepare for this trade, remember to approach the market with discipline and smart risk management. Assess your position size to match your risk tolerance and stay vigilant about market developments.
🔍 Chart Indicators:
📌 Bullish Trend Line
📌 No RSI Divergence
⚠️ Disclaimer: This analysis is for educational purposes only and not financial advice. Forex trading carries inherent risks, and past performance does not guarantee future results. Always conduct your research and seek advice from a qualified financial advisor before making any trading decisions.
Trade with confidence and may the markets favor your trades! 🚀🌕 #ZARJPY #BullishTrade #TechnicalAnalysis #ForexTrading #TradeSmart #BullishMomentum #TradingView

ZARJPY2 Skenario untuk ZARJPY
1. Plan Sell ketika harga memasuki area Supply
2. Tunggu konfirmasi Buy di Area QM jika Supply tertembus

ZARJPYZARJPY has broken it’s uptrend by forming an Lower Higher and the confirmation was also received on July 4, 2023 when it formed a Lower High hence it is a good short opportunity with stop loss set at previous Higher High.

P2P | ZARJPY BreakdownHey family, hope you've all been healthy!
This is short and sweet for anyone wondering about how I take my setups.
Hope this helps simplify things for you! Don't forget to boost if you find value, thank you.
Trade well, stay healthy, and lets keep growing through the journey!

ZARJPY is looking Bullish1.Bullish Divergence at 4h
2. Bullish divergence also at 1H
2. Price bounced back from Support 1(S1)
Method 1
We can enter at support level 1 for long.
We can put a stop loss below the support 2
We can short it from Resistance 1.
In this case, we can add stop loss above the
resistance level 2
Method 2
We can enter at support level 2 for short.
if it went for strong bearish.
We can put a stop loss above the support 1
We can Long it from Resistance 2.
if it went for strong bullish.
In this case, we can add stop loss below the
resistance level 1

Perfect automated detection of Shark & Nenstar PRZ - ShortA bearish-type Shark pattern occurred.
If the price rises to 8.342, a bearish-type Nenstar pattern could occur.
Short after seeing the rebound.
*Harmonic patterns are automatically detected using the indicators below.
- Harmonic auto-detect PRO

Going short on zar jpy Going short on Zar Jpy with a risk to reward of 1:4.6 R as price approaches ob we expect a drop in price


JPYZARI see a long see we got a future resistance level market makers they do all them kinds to cut us off we definitely see what they tryna do.imma be patient with my analysis I trust it with no doubt. It's a perfect trend honestly

10 things to know about trend lines10 things to know about trend lines :
1- They connect two candles minimum. But more is always better, because the more candles there are, the stronger the trend.
2- They can be of 3 types: bullish (pointing up), bearish (pointing down), directionless (drawn horizontally).
3- Trend lines can be traced either on the closing price or on the candlestick wicks. It is up to the trader.
4- They can be visually represented as a line or a zone.
5- When two parallel trend lines are drawn on either side of the same candle, you get a channel. It is a 2D representation of the trend.
6- A trend line is invalidated when it is broken by either the wick or the close of a candle.
7- There are many possible trend lines. The objective is to identify the most relevant of them. The ones that will best predict the price movement.
8- Trend lines can form graphic figures. Each of them will have a specific meaning.
9- Trend line analysis is not 100% reliable. Each trend line has its own probability of success or failure.
10 - The effectiveness of a trend line evolves with the passing of time. It is necessary to constantly update them to remain in phase with the market.

ZARJPY: Bear Flag and ABCD Bearish BAMM Early EntryThe Japanese Yen has begun to gain some strength against many of the Major Pairs and looks to be forming a Bear Flag on the daily that could take us down to the 800 Day EMA in time.
On another note about the JPY strength, there is another much older JPY Strength play that i am still participating in, in the form of GBPJPY that can be seen below:
