MANABTC is going to give another profit plan by formation of a cup and handle pattern, stochastic RSI is also in oversold zone to give more support to move the priceline up. Regards, Atif Akbar (Moon333)
If one candle will be completely closed out of resistance which is shown on chart then the price action will be moved to sell zone and create a complete cypher
BTCUSD is following bearish BAT in short term 1 hr chart can move between 4050 to 4250 for a shorter time period.
On day chart ZECBTC has completed 1st bearish Bat and then a bullish Cypher however in both patterns it has entered in buying zone. The oversold condition of RSI and stochastic is also in favor of bullish divergence soon. Targets are mentioned on charts. Regards, Atif Akbar (Moon333)
XLMBTC has formed a bearish crab pattern and likely to drop soon,the RSI is going for 3rd time in overbought zone. At this time only wick of candles touched the sell area which is defined in chart. As per volume indicator the buyers are still active even on current candle but volume profile is showing that on upper area of candle the trader's interest is weak in...
Massive sell off has invalidated previous cypher pattern which was expected to be formatted by the movement of ZRXBTC now it is likely to form Gartley insha Allah, the new buying and sell zones are defined on chart. Regards, Atif Akbar (Moon333)
At this time when the BTC is at lowest postion of last 420 days and the market cap is dropped from 182 billion to 128 billion in just last 7 days. Market is experiencing substantial losses vs USD in this situation I would like to show some thing optimistic. Here I am only showing the charts putting my sentiments away. If you see the charts of the 2013,2014 and...
REPBTC DAY CHART GARTLEY FOR PRIVATE TRADE
REPETH has entered in sell zone of bearish gartley RSI is already exhausted.
Sofar XRPBTC is following complete cypher pattern and its dimensions now for the formation of C to D leg a drop upto 0.786 fib retracement of X to C leg is expected, the RSI and stochastic are already exhausted which is also in favor of this expected drop , I have updated the chart accordingly. Best of luck and regards, Atif Akbar (Moon333)
After a strong sell off which was triggered on 14 Nov the leading crypto currency found a new support of $5432, after breaking the previouse triangle's support the new move made a falling wedge which is optimistic coz most of the times the falling wedge ends up with a breakout. The volume profile fixed range from every high to low within the wedge is showing that...
Hi guys: XRPBTC made a big spike of 0.00011750 on 21 sep, it seems to be unrealistic to take it for any harmonic pattern therefore I took the point for A leg where we have maximum touches, now it seems likely to make a cypher. The B leg is dropped not more than 0.618 fib retracement of X to A leg and going to draw C leg which is expected upto 127.2% to 141.4% fib...
After a massive breakout first drop shows possibly formation of Gartely insha Allah, but if it will be dropped more than the sell zone defined on the chart before touching atleast 1st target 0.000237 then it will be invalidated. Best of luck, Atif Akbar (Moon333)
After giving 58 percent proftit from 7 nov to 14 nov the QKC is facing a strong resistance at 0.00000960, much chances of drop from here. Sofar it is following the CRAB harmonic pattern so if it will start falling from here then a strong sell off atleast till 0.00000107 is expected. I would suggest to short the QKC from this position and take a long position...
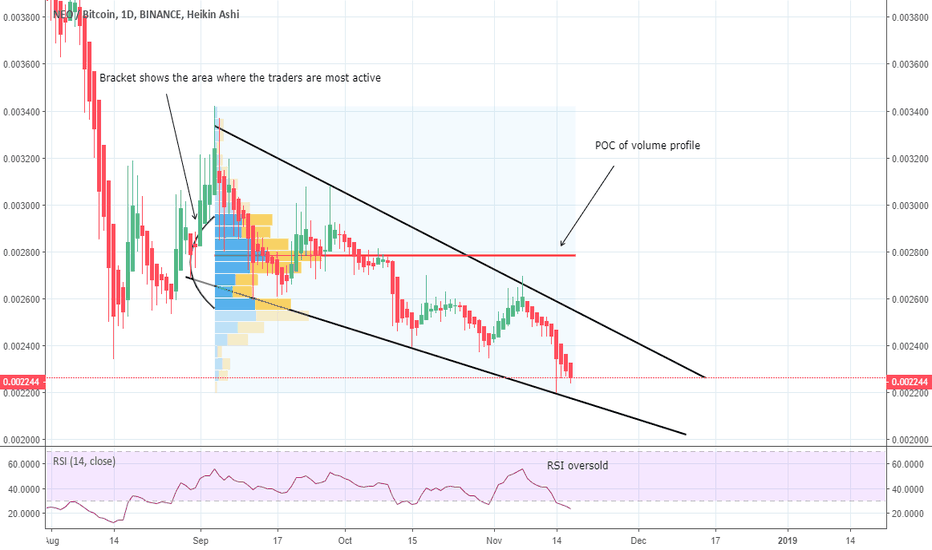
The price action of NEOBTC is in a falling wedge since 30 aug, now the RSI and stochastic are in oversold condition. I took the fixed range of volume profile of almost complete wedge's priceline and it is showing that the trader's interest is weakening at the support and on resistance or even above the resistance interest of trader is strong which is giving signal...
Since 17 aug the XEMBTC was in a pennant now on 12 nov the price action has broken the resistance of pennant with powerfull volume after making double bottom within the pennant, now the price line is still above the pennant's resistance even after the fib retracement showing a bullish move it has created a first bull flag, here I have placed a pitch fork the price...
On weekly chart since April 2018 the IOTBTC is falling, according to bitfinex stats the loss is almost 80 percent. Now the priceline has almost touched the bottom of a Gartley pattern which is made by the movement of price action of the coin, the RSI and stochastic are oversold. Now there are much chances of huge breakout from the long position area. The volume...
The price action has followed a bullish crab now the RSI is moving up after exhaustion, The price might move up from here. The targets are set as per current priceline but if the price drops more then new targets should be set according to Fibonacci retracement according to new price action. Best of luck and Regards, Atif Akbar (Moon333)


