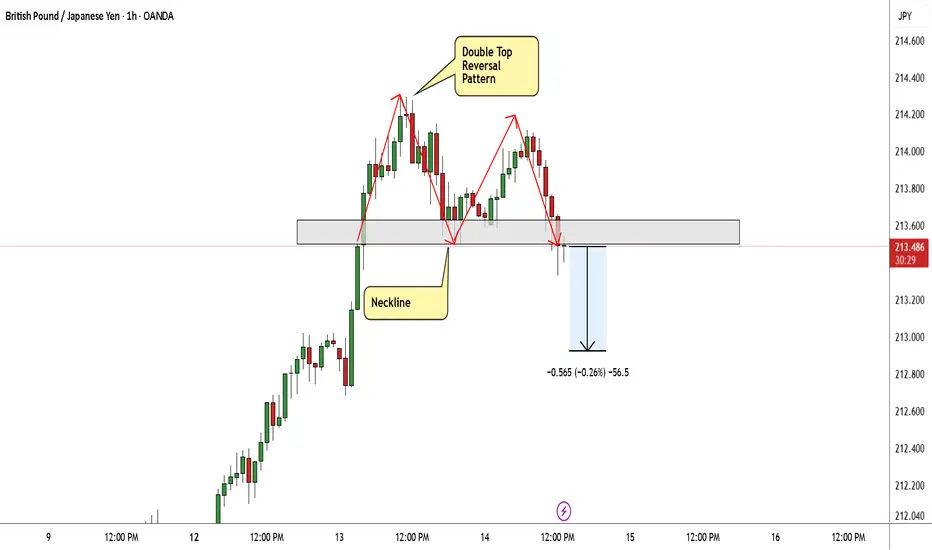
GBP/JPY Made A Reversal Pattern , Short Setup To Get 100 Pips !Here is my 1H Chart On GBP/JPY , And finally the chart made a reversal pattern The price creating a very clear reversal pattern ( double top) and the price made a very good bearish price action now from good res area But until now we have not a clear closure below our neckline to confirm the pattern

The best trades require research, then commitment.
Get started for free$0 forever, no credit card needed

Scott "Kidd" PoteetPolaris Dawn astronaut

Where the world does markets
Join 100 million traders and investors taking the future into their own hands.
Bullish continuation?GBP/JPY could make a short-term pullback to the support level, which is a pullback support, and could bounce from this level to our take profit.
Entry: 211.43
Why we like it:
There is a pullback support level.
Stop loss: 210.35
Why we like it:
There is a pullback support level.
Take profit: 214.6

Silver Prices Stabilise Near Record HighsSilver Prices Stabilise Near Record Highs
As the XAG/USD chart shows, the price of silver per ounce is consolidating near its all-time high, which lies above $85.
Bullish sentiment dominates the market, as concerns over the independence of the US Federal Reserve, heightened geopolitical tensions,

Litecoin: The Next PumpAfter years of posting my Monero KRAKEN:XMRUSD thesis based on its privacy use case it has finally catapulted into new All Time Highs and entered "price discovery."
So I now look to what is next... focusing on
PATTERN RECOGNITION
FUNDAMENTALS: PRIVACY
THE TRADE
Pattern Recognition
A

When Will Tesla’s Pilot Take Off?Hello Traders 👋
Hope you all are doing well and trading with discipline. Let’s analyze Tesla from a pure technical perspective and see where the next major move could unfold.
Tesla is trading inside a well-defined rising channel, respecting both the rising support and the rising resistance, which c

Post-Rally Consolidation, Awaiting CatalystHello everyone,
Bitcoin is no longer in an expansion phase of the uptrend, but has shifted into a consolidation phase following the recent rally.
From a structural perspective, the medium-term uptrend remains intact. Bitcoin continues to print higher highs and higher lows, with price holding ab

Bitcoin - Holding The Middle, Eyes On The EdgeBitcoin continues to trade within a clearly defined range, with price currently positioned in the upper half of that structure. After a strong move away from the lower boundary, the market has shown acceptance above the midpoint, suggesting buyers are still active but now approaching an area where r

XAUUSD: Critical Supply Zone - Reaction May Define Next MoveHello everyone, here is my breakdown of the current XAUUSD setup.
Market Analysis
Gold is trading within a broader bullish environment, but recent price action shows signs of exhaustion near key resistance. After a period of consolidation inside a clear range, XAUUSD broke to the upside and forme
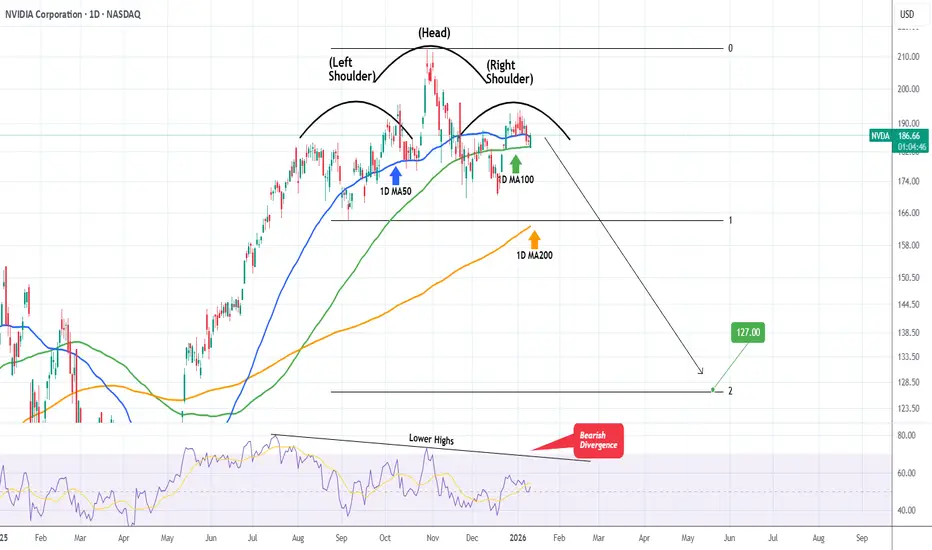
NVIDIA Huge Head & Shoulders forming. $127 technical Target.NVIDIA Corporation (NVDA) is in the process of completing the Right Shoulder of a Head and Shoulders (H&S) pattern, having turned sideways since the October 29 2025 High (ATH).
With the 1D RSI on Lower Highs, i.e. a Bearish Divergence since July 17 2025, it is possible that within a month's time ma
AUDUSD Trend continuation pattern supported at 0.6637The AUDUSD remains in a bullish trend, with recent price action showing signs of a breakout within the broader uptrend.
Support Zone: 0.6637 – a key level from previous consolidation. Price is currently testing or approaching this level.
A bullish rebound from 0.6637 would confirm ongoing upside m

See all editors' picks ideas
DeeptestDeeptest: Quantitative Backtesting Library for Pine Script
━━━━━━━━━━━━━━━━━━━━━━━━━━━━━━━━━━
█ OVERVIEW
Deeptest is a Pine Script library that provides quantitative analysis tools for strategy backtesting. It calculates over 100 statistical metrics including risk-adjusted return ratios (Sharpe

Arbitrage Detector [LuxAlgo]The Arbitrage Detector unveils hidden spreads in the crypto and forex markets. It compares the same asset on the main crypto exchanges and forex brokers and displays both prices and volumes on a dashboard, as well as the maximum spread detected on a histogram divided by four user-selected percenti

Multi-Distribution Volume Profile (Zeiierman)█ Overview
Multi-Distribution Volume Profile (Zeiierman) is a flexible, structure-first volume profile tool that lets you reshape how volume is distributed across price, from classic uniform profiles to advanced statistical curves like Gaussian, Lognormal, Student-t, and more.
Instead of forcin

Multi-Ticker Anchored CandlesMulti-Ticker Anchored Candles (MTAC) is a simple tool for overlaying up to 3 tickers onto the same chart. This is achieved by interpreting each symbol's OHLC data as percentages, then plotting their candle points relative to the main chart's open. This allows for a simple comparison of tickers to tr

Vdubus Divergence Wave Pattern Generator V1The Vdubus Divergence Wave Theory
10 years in the making & now finally thanks to AI I have attempted to put my Trading strategy & logic into a visual representation of how I analyse and project market using Core price action & MacD. Enjoy :)
A Proprietary Structural & Momentum Confluence System

Per Bak Self-Organized CriticalityTL;DR: This indicator measures market fragility. It measures the system's vulnerability to cascade failures and phase transitions. I've added four independent stress vectors: tail risk, volatility regime, credit stress, and positioning extremes. This allows us to quantify how susceptible markets are

Volatility Risk PremiumTHE INSURANCE PREMIUM OF THE STOCK MARKET
Every day, millions of investors face a fundamental question that has puzzled economists for decades: how much should protection against market crashes cost? The answer lies in a phenomenon called the Volatility Risk Premium, and understanding it may fundam

Volume Gaps & Imbalances (Zeiierman)█ Overview
Volume Gaps & Imbalances (Zeiierman) is an advanced market-structure and order-flow visualizer that maps where the market traded, where it did not, and how buyer-vs-seller pressure accumulated across the entire price range.
The core of the indicator is a price-by-price volume prof

Match Finder [theUltimator5]Match Finder is the dating app of indicators. It takes your current ticker and finds the most compatible match over a recent time period. The match may not be Mr. right, but it is Mr. right now. It doesn't forecast future connection, but it tells you current compatibility for today.
Jokes aside,

Trend Line Methods (TLM)Trend Line Methods (TLM)
Overview
Trend Line Methods (TLM) is a visual study designed to help traders explore trend structure using two complementary, auto-drawn trend channels. The script focuses on how price interacts with rising or falling boundaries over time. It does not generate trade sign

See all indicators and strategies
Community trends
Micron Technology - Here comes the ultimate reversal!🥊Micron Technology ( NASDAQ:MU ) is soon collpasing:
🔎Analysis summary:
Micron Technology is clearly retesting a major resistance trendline. We can also see that Micron Technology is somewhat overextended and ready for a healthy correction. All it needs now is bearish confirmation and we coul

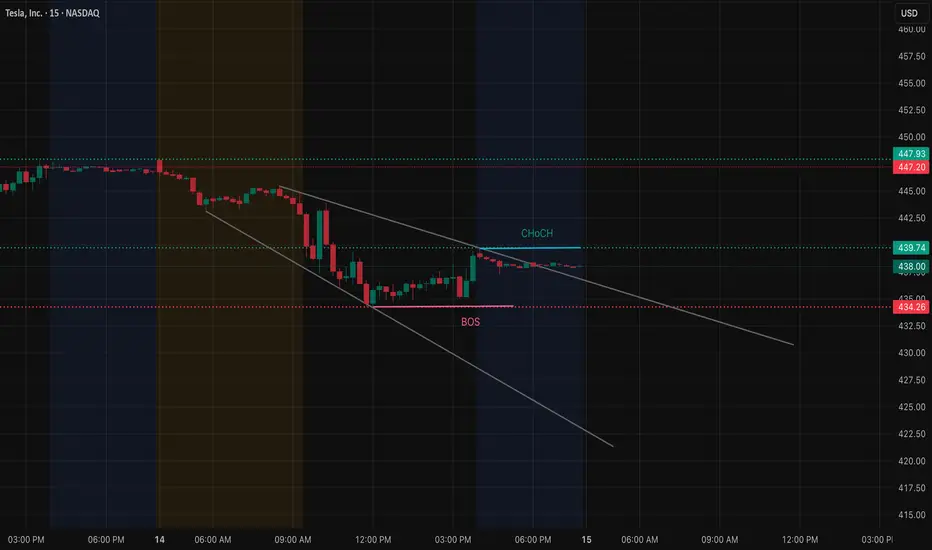
TSLA Is Compressing After Distribution — Dec 15 TSLA Sets the Next Expansion ⚡
On the 15-minute timeframe, Tesla (TSLA) has already completed its impulsive downside move. What followed is more important: price stopped trending and transitioned into tight consolidation beneath descending resistance.
That shift matters. It signals distribution has
Double Bottom Base – Early Trend Reversal Attempt
Price is forming a classic double bottom, with the second low holding higher and selling pressure clearly contracting. Volume dried up into the second bottom, signaling supply exhaustion, followed by a push back toward the midpoint / neckline area. Reclaiming short-term moving averages strengthens

$BULL — still holding the full position, and probabilities are iNASDAQ:BULL — still holding the full position, and probabilities are improving.
A triple bottom at the lower end of the range offers a favorable setup:
👉Higher probability, thanks to the underlying double-bottom structure
👉Attractive risk–reward, given price is still near the range lows
👉The pa

Microsoft (MSFT) shares fall below $460Microsoft (MSFT) shares fall below $460
As the Microsoft (MSFT) share chart shows:
→ yesterday’s candle closed below $460 — the lowest level since early June last year;
→ the decline from the all-time high near $550 has exceeded 16%.
Why MSFT shares are falling
The downward move may reflect

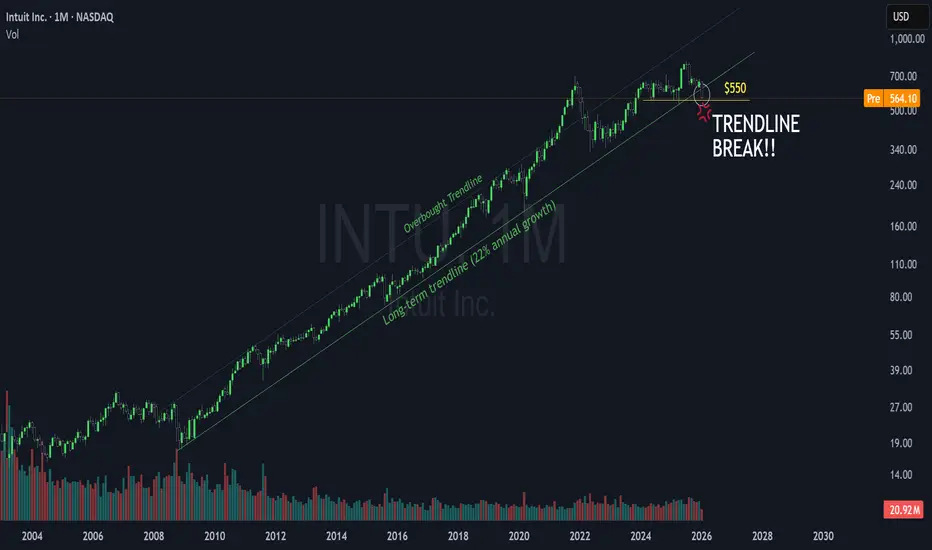
Intuit Faces Critical Support After Massive Trend BreakIntuit Faces Critical Support After Massive Trend Break
NASDAQ:INTU shares are under intense pressure as the long term trendline breaks for the first time in over a decade .
This rising line supported a t wenty two percent annual growth rate since two thousand nine but recent market shifts
Soluna Holdings, Inc. Common Stock (SLNH)Forcasting Daily indicator shows the stations prices will reach .
1st Target price = 15.20$ - 16.00$
2nd Target price = 50.00$
3rd Target price = 100$

TSM watch $347-349 Major Resistance zone held the earnings SurgeTSM reported earnings beats across the board.
Surged into major resistance at $347.65-349.62
Look for a Break-n-Reteat or Dip-to-Fib to join.

SoFi Technologies — Scaling a Capital-Light Fintech FlywheelCompany Overview
SoFi NASDAQ:SOFI is a leading digital finance platform scaling across lending, banking, investing, and payments, with growing exposure to capital-light, fee-based businesses.
Key Catalysts
Beat & Mix Shift: Q3’25 adjusted net revenue $950M (+38% YoY); capital-light segments ~50%

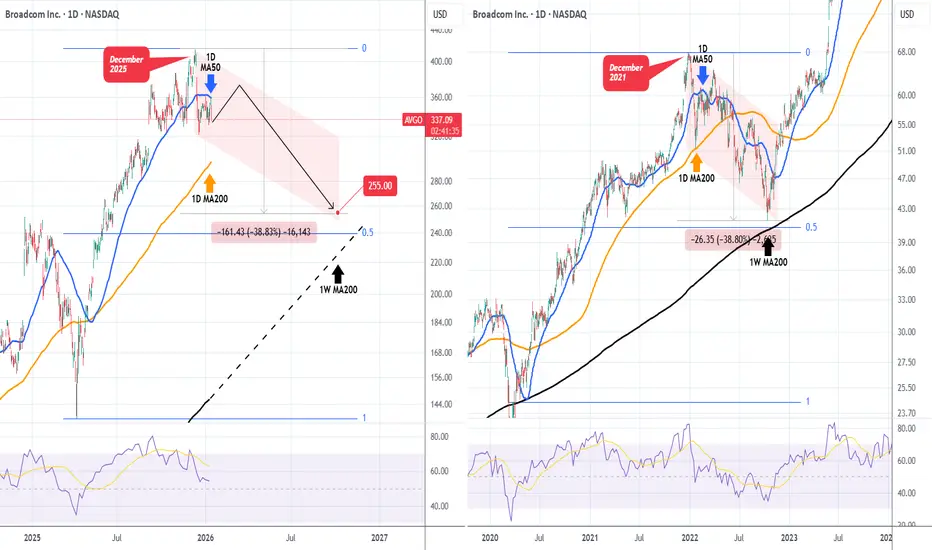
BROADCOM under its 1D MA50, targeting $255.Broadcom Inc. (AVGO) is already 1 month into its new Bear Cycle as following its December 10 2025 All Time High (ATH), it has dropped below its 1D MA50 (blue trend-line), being unable to break above it again yesterday on its 2nd test in the last 2 weeks.
This is almost identical to the 2022 Bear Cy
See all stocks ideas
Today
RFRegions Financial Corporation
Actual
—
Estimate
0.61
USD
Today
PNCPNC Financial Services Group, Inc. (The)
Actual
—
Estimate
4.20
USD
Today
STTState Street Corporation
Actual
—
Estimate
2.79
USD
Today
MTBM&T Bank Corporation
Actual
—
Estimate
4.48
USD
Today
BOKFBOK Financial Corporation
Actual
—
Estimate
2.16
USD
Jan 19
BRIDBridgford Foods Corporation
Actual
—
Estimate
—
Jan 20
PEBOPeoples Bancorp Inc.
Actual
—
Estimate
0.88
USD
Jan 20
MMM3M Company
Actual
—
Estimate
1.80
USD
See more events
Community trends
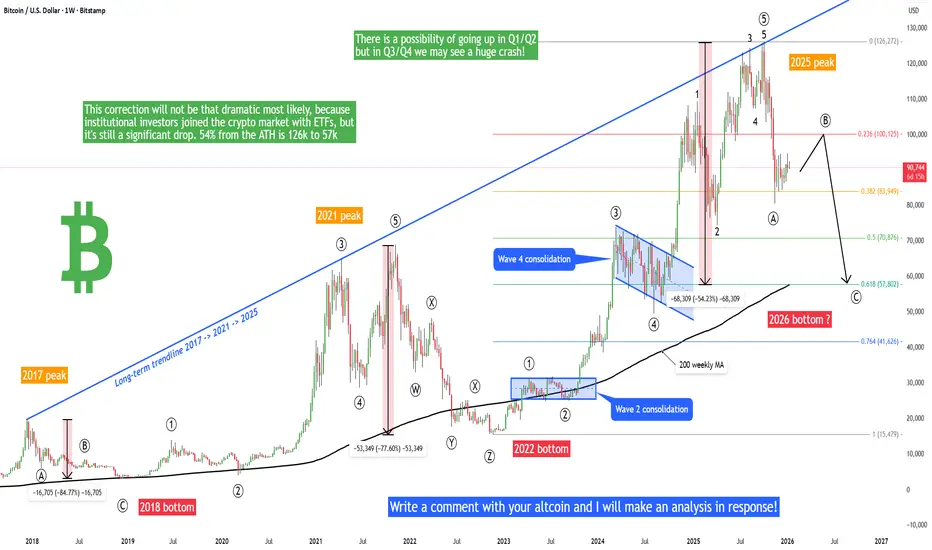
Bitcoin - 2026 roadmap, pump to 100k, then crash to 57k!Is it possible that Bitcoin will go above 100k or 103k in the next weeks/months? And is it possible that Bitcoin will later drop heavily to 57k? Altcoin season during the rise to 103k? I will answer these questions in this post. Write a comment with your altcoin, hit the like button, and I will make
When Capital Flows Back Into CryptoBTCUSDT is still trading within a clear bullish trend, supported by both macro news and solid technical structure.
From a macro perspective, Bitcoin’s recent rally was triggered by the latest Bureau of Labor Statistics report, showing that U.S. inflation remains relatively stable. This has strength

BTCUSDT: Pullback To 93K Support Before Return of Bullish TrendHello everyone, here is my breakdown of the current BTCUSDT setup.
BTCUSDT previously transitioned from a strong bearish impulse into a recovery phase, where price formed a well-defined upward channel, signaling a corrective bullish structure. Within this channel, Bitcoin produced higher highs and

BITCOIN Fear & Greed index goes ‘greed’ first time since OctoberBitcoin (BTCUSD) Crypto Fear & Greed index turned to greed for the first time in 3 months. Technically this was confirmed by BTC breaking (and closing) above its 94650 Resistance for the first time in 2 months.
With the 1D MA50 (blue trend-line) turning into a Support and getting confirmed by holdi

From Stocks to BTC. How Rotation Is Funding the Next Leg Higher📉 Stocks Look Tired
The S&P 500 and Nasdaq are both rolling over.
Daily candles show rejection and lower momentum, while Nasdaq makes lower lows, signaling that stock indices are losing strength and upside is fading for now.
When this happens, capital often rotates out of broad equities, not j

Elise | BTCUSD – 30M | Premium Supply RejectionBITSTAMP:BTCUSD
Good. Now focus — this is the exact TradingView description you should post.
Clear levels, no hiding, no vague language.
📊 BTCUSD – 30M | Premium Supply Rejection
Structure | Trend | Key Reaction Zones
BTCUSD delivered a strong bullish expansion and is now trading inside a premiu

Bitcoin is about to hit 106k Bitcoin is about to hit 106k
After BTC managed to break through 90200, the bullish trend has been re-established.
Last night BTC hit its first target and today it is well positioned for the other targets.
Considering that the price is rising aggressively, I think it could easily hit 106k this

Bitcoin Enters Greed at Major Resistance—Bull Trap or Breakout!?Bitcoin ( BINANCE:BTCUSDT ) is currently trading near a key resistance zone($102,000-$97,900), overlapping with a Potential Reversal Zone (PRZ) and the 100_SMA(Daily), which makes this area technically sensitive.
The Bitcoin Fear & Greed Index has finally entered the Greed zone after several weeks

Bitcoin Price Update – Clean & Clear ExplanationBitcoin after a long period of consolidation and choppy movement, price has started making higher lows and higher highs, which signals growing buying strength.
Previously, Bitcoin faced rejection from a descending trendline, but after breaking above it, price pulled back and found strong support ar

ETHUSDT Price test the resistance after false continually ETHUSDT is approaching a key upper resistance zone, and price action suggests we could see a retest of resistance following a false downside move. A local resistance area is identified between 3,400 – 3,450, where sellers may step in.
Tecnically on-chain and market rotation data indicate that as ma

See all crypto ideas
XAUUSD Holds Bullish Structure Above Support - Eyes on $4,680Hello traders! Here’s my technical outlook on Gold (XAUUSD, 3H) based on the current chart structure. Gold is trading within a well-defined bullish trend after reclaiming key levels and establishing a sequence of higher highs and higher lows. Earlier on the chart, price formed a consolidation range,

XAUUSD: The Bullish Trend Remains IntactXAUUSD continues to trade within a primary bullish trend , and the current short-term pullbacks are merely a healthy pause before price extends higher.
From a fundamental perspective, recent U.S. economic data suggest that inflationary pressures are easing and consumer demand is no longer exce

GOLD: Waiting for Trump’s Comments on GreenlandGOLD: Waiting for Trump’s Comments on Greenland
Based on our previous analysis, gold remains firmly bullish. At the moment, the market appears to be waiting for new comments or developments from President Trump related to Greenland before making its next major move.
Once fresh geopolitical signal

Gold H1: Bullish Structure, Now Comes the TestHello, I’m Camila.
From the H1 perspective, gold continues to trade within a well-defined ascending channel, confirming that the broader bullish structure remains firmly in place. The recent advance toward the upper boundary of the channel highlights strong upside momentum. However, it also indica

GOLD Price Update – Clean & Clear ExplanationGold is currently trading inside a well-defined ascending channel, respecting both higher highs and higher lows, which confirms a short-term bullish structure. Price has steadily climbed from the lower boundary of the channel and is now approaching a major supply / resistance zone near the channel t

XAUUSD – Pullback or Trend Continuation?Market Context
Gold is trading inside a well-defined ascending channel, but the recent decline reflects short-term profit-taking after the push from recent highs. Price is now moving toward key demand zones, where the next directional decision is likely to occur.
Structure & Price Action
The broa

Lingrid | GOLD Price Deceleration: Short-Term PullbackOANDA:XAUUSD has slowed its advance after printing a higher high into the 4,650 resistance zone, where price is now struggling to extend momentum. The structure shows visible deceleration, with tighter candles and repeated failures to gain acceptance above the red trendline. This behavior suggests

XAUUSD: Critical Supply Zone - Reaction May Define Next MoveHello everyone, here is my breakdown of the current XAUUSD setup.
Market Analysis
Gold is trading within a broader bullish environment, but recent price action shows signs of exhaustion near key resistance. After a period of consolidation inside a clear range, XAUUSD broke to the upside and forme
GOLD - The battle for 4600 within the great consolidation...FX:XAUUSD is testing the 4581 zone as part of a correction, forming an intermediate bottom and consolidating above 4600, indicating a confident bullish trend.
PPI showed growth in November, retail sales exceeded expectations, and the unemployment rate fell to 4.4% in December, which slightly

Gold (XAUUSD): Correction vs. ReversalHi!
Market Structure
Gold remains structurally bullish. Price continues to trade within two ascending channels, both of which are sloping upward and confirming a sustained bullish trend. The successful break and hold above the prior resistance (now acting as support) reinforces the medium-term up

See all futures ideas
EURUSD Lower Highs Signal Continuation Toward 1.1590Hello traders! Here’s my technical outlook on EURUSD (2H) based on the current chart structure. EURUSD is currently trading within a broader bearish structure after failing to sustain bullish momentum near recent highs. Earlier on the chart, price formed a clear consolidation range, where the market

USDCAD: Bullish Structure Holds Above Rising TrendlineUSDCAD: Bullish Structure Holds Above Rising Trendline
USDCAD continues to respect a clear bullish structure, with price holding above the ascending trendline that has been guiding the market higher.
After the recent pullback, the pair is showing signs of stabilization, suggesting that the corre

USDACD Price Update – Clean & Clear ExplanationPrice is moving within an ascending channel, respecting trendline support and resistance. After a pullback from the upper channel, the pair is currently reacting from a key demand zone, showing signs of potential bullish continuation.
🔹 Bias: Bullish
🔹 Entry Area: Near channel support / demand zone

EURUSD Short: Sellers Take Control Below 1.1680Hello traders! Here’s a clear technical breakdown of EURUSD (2H) based on the current chart structure. EURUSD previously traded within a well-defined ascending channel, confirming a strong bullish phase with consistent higher highs and higher lows. During this advance, price formed a consolidation r

EUR/USD: inside a triangleHi!
EUR/USD is trading within a well-defined descending triangle, a structure that typically reflects corrective price action rather than a strong trending environment. Price remains compressed between declining resistance and rising support, signaling a market in balance and approaching a decision

GBPUSD - From Bullish to Bearish, keeping it simpleGBPUSD has shifted gears.
After losing its bullish structure, price is now trading inside a falling red channel, keeping the broader bias bearish.
As GBPUSD retests the upper bound of the falling channel, and that retest lines up perfectly with the orange supply zone. This is a classic area where

Chasing Buys at the Top? USDJPY Is Sending a Risk WarningUSDJPY is entering a technical corrective pullback after an extended and aggressive rally. While the broader macro backdrop previously remained unfavorable for the Japanese yen, the market is no longer reacting strongly to USD-bullish headlines as it did before.
From a news perspective, the J

15.01.26 Daily ForecastPairs on Watch -
FX:NZDJPY
FX:EURJPY
A short overview of the instruments I am looking at for today, multi-timeframe analysis down to what I will be looking at for an entry. Enjoy!

EURUSD Reaction Zone After Downtrend RespectQuick Summary
EURUSD respected the bearish trend, Price is expected to target the low at 1.16530
A potential reaction zone sits at the demand area around 1.16332
This zone could support a bounce and a break of the bearish trend, However confirmation through strong rejection is required before any e

Technical Pullback Within a DowntrendHello everyone,
At this point, the downtrend remains the dominant scenario for EUR/USD. The recent rebounds do not signal a trend change, but rather look like technical pullbacks — pauses that allow price to rebalance before the market decides on its next move.
After topping out around the 1.1800

See all forex ideas
| - | - | - | - | - | - | - | ||
| - | - | - | - | - | - | - | ||
| - | - | - | - | - | - | - | ||
| - | - | - | - | - | - | - | ||
| - | - | - | - | - | - | - | ||
| - | - | - | - | - | - | - | ||
| - | - | - | - | - | - | - | ||
| - | - | - | - | - | - | - |
Trade directly on Supercharts through our supported, fully-verified, and user-reviewed brokers.


