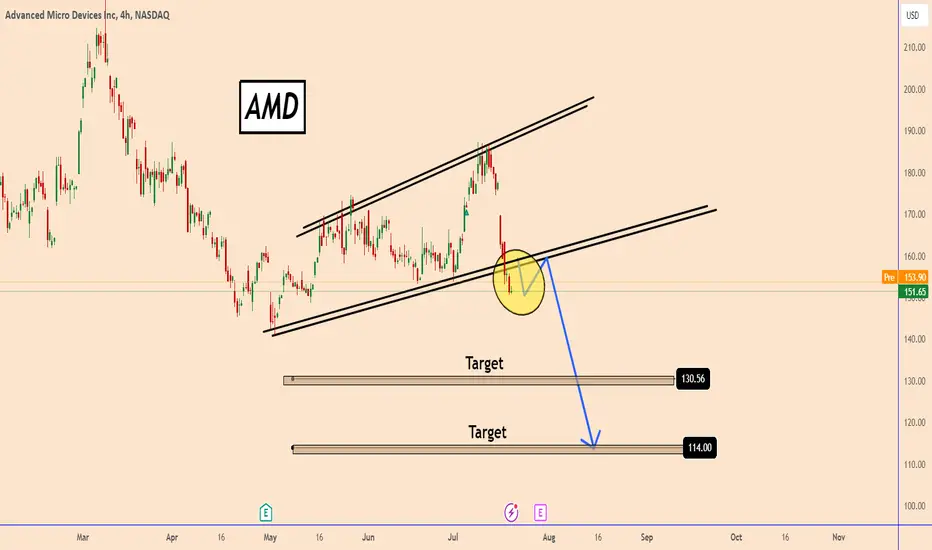
AMD indicates potential weakness- HIGH RISKAMD indicates potential weakness- HIGH RISK
From our previous analysis AMD reached our bullish target and now we can see a complete transformation.
Today AMD is showing a bearish continuation pattern indicating further price decline.
The wave we may have this time will be only a corrective wave b
Key facts today
Next report date
—
Report period
—
EPS estimate
—
Revenue estimate
—
0.69USD
854.00 MUSD
22.68 BUSD
1.61 B
About Advanced Micro Devices Inc
Sector
Industry
CEO
Lisa T. Su
Website
Headquarters
Santa Clara
Employees (FY)
26 K
Founded
1969
FIGI
BBG000BBQCY0
Advanced Micro Devices, Inc engages in the provision of semiconductor businesses. It operates through the following segments: Computing & Graphics, and Enterprise, Embedded and Semi-Custom. The Computing and Graphics segment includes desktop and notebook processors and chipsets, discrete and integrated graphics processing units, data center and professional GPUs and development services. The Enterprise, Embedded and Semi-Custom segment includes server and embedded processors, semi-custom System-on-Chip products, development services and technology for game consoles. The company was founded by W. J. Sanders III on May 1, 1969 and is headquartered in Santa Clara, CA.
AMD - Correction of -40% over?NASDAQ:AMD just created a new all time high, however we have to be quite careful now.
Volatility is the basis of every major trading position and trading profit. Advanced Micro Devices is just such a stock which offers volatile swings every now and then. Currently Advanced Micro Devices is retes

AMD: Earnings TradeAMD reports earning next Tuesday and is currently resting on a support zone from DEC/JAN. I am taking a small CALL position before earnings with the anticipation of a 175 gap fill and potential move to 184 in the next few weeks. If you follow this trade, I would recommend taking a small position, so

AMD Bear Butterfly Versus AMD Bull Butterfly.the detail is shown in the above Idea.
AMD bear butterfly is formed completely and angry buyers were present in 1.27 F
and now AMD bull Butterfly Is ready ( after growing right eye) to fly higher and higher.

AMD sitting at KL with a Head and Shoulders - Added Supply ZoneAMD had strong selling pressure this week and is now sitting at a Key Supply Level with a clear Head and Shoulders pattern formation. Further downside could trigger further selloff. This analysis is for informational purposes only.

$AMD - short term retracementHammered back off of resistance, there are multiple resistance channels at this level. Entering bearish portion of regression channel.
Processor industry getting hit because NVDA is reversing and may be dragging the overall sector as well.
Few red days in a row, short term bearish chat forming
Ta

Advanced Micro Devices Inc _ Quarter 3 _ Distribution _ Prices Advanced Micro Devices Inc _ Quarter 3 _ Distribution _ Prices _ Under _ Trading _ Venue _ NASDAQ
1st Distribution:
$180.82
$192.71
_____________
2nd Distribution:
$199.02
$221.39
______________
3rd Distribution:
$221.39
$245.85

AMD Megaphone BreakAMD just broke below its megaphone after having a rejection off the top end. I'd consider this to be a pretty major break that should lead to more downside if there's no quick recovery.


AMD looks bearish
-Big time indicators are bearish as well as chart pattern shows price goes under previous all time highs signing more down side push expected.
-look closely around $165 level if price pulls back and consolidate around that area next day or two.
- If bounces down, the next targets are $145 and $1

See all ideas
An aggregate view of professional's ratings.
Trade directly on the supercharts through our supported, fully-verified and user-reviewed brokers.


Curated watchlists where AMD is featured.


Frequently Asked Questions
The current price of AMD is 139.99 USD — it has increased by 1.21% in the past 24 hours. Watch Advanced Micro Devices Inc stock price performance more closely on the chart.
Depending on the exchange, the stock ticker may vary. For instance, on NASDAQ exchange Advanced Micro Devices Inc stocks are traded under the ticker AMD.
AMD stock has fallen by 9.60% compared to the previous week, the month change is a 12.83% fall, over the last year Advanced Micro Devices Inc has showed a 25.23% increase.
We've gathered analysts' opinions on Advanced Micro Devices Inc future price: according to them, AMD price has a max estimate of 250.00 USD and a min estimate of 135.00 USD. Watch AMD chart and read a more detailed Advanced Micro Devices Inc stock forecast: see what analysts think of Advanced Micro Devices Inc and suggest that you do with its stocks.
AMD stock is 2.18% volatile and has beta coefficient of 2.30. Track Advanced Micro Devices Inc stock price on the chart and check out the list of the most volatile stocks — is Advanced Micro Devices Inc there?
Today Advanced Micro Devices Inc has the market capitalization of 223.57 B, it has decreased by 3.41% over the last week.
Yes, you can track Advanced Micro Devices Inc financials in yearly and quarterly reports right on TradingView.
Advanced Micro Devices Inc is going to release the next earnings report on Jul 30, 2024. Keep track of upcoming events with our Earnings Calendar.
AMD earnings for the last quarter are 0.62 USD per share, whereas the estimation was 0.62 USD resulting in a 0.67% surprise. The estimated earnings for the next quarter are 0.68 USD per share. See more details about Advanced Micro Devices Inc earnings.
Advanced Micro Devices Inc revenue for the last quarter amounts to 5.47 B USD, despite the estimated figure of 5.48 B USD. In the next quarter, revenue is expected to reach 5.72 B USD.
AMD net income for the last quarter is 123.00 M USD, while the quarter before that showed 667.00 M USD of net income which accounts for −81.56% change. Track more Advanced Micro Devices Inc financial stats to get the full picture.
No, AMD doesn't pay any dividends to its shareholders. But don't worry, we've prepared a list of high-dividend stocks for you.
As of Jul 27, 2024, the company has 26.00 K employees. See our rating of the largest employees — is Advanced Micro Devices Inc on this list?
EBITDA measures a company's operating performance, its growth signifies an improvement in the efficiency of a company. Advanced Micro Devices Inc EBITDA is 4.07 B USD, and current EBITDA margin is 18.41%. See more stats in Advanced Micro Devices Inc financial statements.
Like other stocks, AMD shares are traded on stock exchanges, e.g. Nasdaq, Nyse, Euronext, and the easiest way to buy them is through an online stock broker. To do this, you need to open an account and follow a broker's procedures, then start trading. You can trade Advanced Micro Devices Inc stock right from TradingView charts — choose your broker and connect to your account.
Investing in stocks requires a comprehensive research: you should carefully study all the available data, e.g. company's financials, related news, and its technical analysis. So Advanced Micro Devices Inc technincal analysis shows the sell today, and its 1 week rating is sell. Since market conditions are prone to changes, it's worth looking a bit further into the future — according to the 1 month rating Advanced Micro Devices Inc stock shows the buy signal. See more of Advanced Micro Devices Inc technicals for a more comprehensive analysis.
If you're still not sure, try looking for inspiration in our curated watchlists.
If you're still not sure, try looking for inspiration in our curated watchlists.