The TradingView Show: Charting Big Rotations with TradeStationOur discussion will dive into the breakout charts of small caps, the ongoing chatter about interest rates, and the shift among Fed members towards a dovish stance. We'll also examine the implications of the slowing AI stock boom and the increasing participation of stocks in catching a bid in the bro
Explore the community

Ethereum ETFs Pump Out $1B in Trading Volume. But When Record?The novel asset class debuted for trading on Wall Street with about a billion dollars worth of trades. But Ether’s price didn’t move an inch. In fact, it dropped, confusing traders who were expecting a more impressive performance by the megacap token. What happened?
Ether ETFs Make a Splash on Wa

GOLD to find sellers at market price?Gold - 24h expiry
Posted a Double Top formation.
Short term bias has turned negative.
5 negative daily performances in succession.
20 4hour EMA is at 2411.5.
We look for a temporary move higher.
We look to Sell at 2411.5 (stop at 2427.5)
Our profit targets will be 2371.5 and 2361.5
Resista

Walk Through WallsBitcoin no longer has any interesting or meaningful proposition beyond its public rhetoric. It is a paper tiger. In the coming years, it will see immense success as it is adopted by various funds and political narratives. However, its ecosystem's development has lagged so severely that it cannot eve

Bitcoin: No Moon Anytime Soon.Bitcoin: My previous week's anticipated scenario flailed to play out but in all fairness was never confirmed by the market on this time frame (short setup off 60K). Price is now flirting within the upper boundaries of the 64-66K resistance AREA which was previously a support. With this in mind, I an

The Semiconductor Bubble is Finally PoppingI believe it is time for one of the biggest bubbles in history to be popped. I'm talking about semiconductors here, but really I would call this entire situation an "everything bubble." i think it all starts with semiconductors though, once the bubble pops it's going to get ugly quick and shorts wil

What Technical Analysis Says Nvidia Stock Might Do From HereNvidia NASDAQ:NVDA is an interesting stock in that it’s up almost 185% over 12 months as of July 17 -- but has rallied and sold off over the past two months. So, what now?
Let’s see what the stock’s chart as of July 17 might show us:
The first thing you might notice is that NVDA hit a “basi

Megacaps vs Small Caps: Has Nvidia Done This Before?Nvidia has embodied the megacap growth trend for more than a year. Now there could be signs of sentiment shifting -- at least for a little while.
Today’s idea uses two charts to consider potential changes in market conditions.
First, Jensen Huang’s semiconductor giant showed some potentially simil

Gold Hits Record Highs! Skyrocket Further or Sharp Reversal?4-Hour Time Frame Analysis:
Higher Highs (HH) and Higher Lows (HL): The chart displays a clear upward trend with higher highs and higher lows. This indicates a bullish market structure.
Ascending Channel: The price is moving within an ascending channel, showing a steady increase in value.
Key Lev

BTCUSD - $63,000 - $65,000 Imminent... This weekend, i was expecting a selloff into $52,000 but wat happened was a low resistance liquidity run into premium arrays.
Looking at the daily order block array @ $63,866 as the first point of interest.
We also have a weekly array just above that area which spans upto FWB:65K

See all editors' picks ideas
Exploring Trading Basics: Expert Tips for New TradersWelcome to the thrilling world of trading, future market experts! If you’re stepping into this arena for the first time, it’s natural to feel both excited and a little overwhelmed. No worries — we’ve set up this nice value-packed TradingView Idea to make you feel at home. Read on for practical tips


Divergence: RSI vs. PriceHey everyone!
In my years of trading, I've really come to love Reversal Strategies and my favorite is in the form of a DIVERGENCE!
Today, I took some time to put together an Educational Video on:
1) What a Divergence Is?
2) How to Spot them!
&
3) How to Trade them!
I hope you find this helpful!

Timing when day trading can be everythingTiming when day trading can be everything
In Stock markets typically more volatility (or price activity) occurs at market opening and closings
When it comes to Forex (foreign exchange market), the world’s most traded market, unlike other financial markets, there is no centralized marketpl

Incorporating Alternative Investments into Portfolio BuildsIncorporating alternative investments such as private equity, hedge funds, and real assets can be a rewarding strategy for diversification and enhancing returns. These alternative assets provide unique risk-return profiles that can complement traditional investments in forex, commodities, and indice

Why Using Charts Can Help You with Your TradingImagine you've decided to buy a particular stock. Your position starts to make money, and you're thrilled. But what do you do now? Should you hold onto your position or cash it in? Has it made enough profit, or will it go further? It's painful to lose money, but it's also frustrating to take profits

Optimizing Technical Analysis with Logarithmic Scales▮ Introduction
In the realm of technical analysis, making sense of market behavior is crucial for traders and investors. One foundational aspect is selecting the right scale to view price charts. This educational piece delves into the significance of logarithmic scaling and how it can enhance your

Volume Spread Analysis (VSA): Volume and Price DynamicsVolume Spread Analysis (VSA): Understanding Market Intentions through Volume and Price Dynamics.
█ Simple Explanation:
Volume Spread Analysis (VSA) is a trading technique that identifies key market patterns and trends by analyzing the relationship between volume and price spread, revealing trader

See all editors' picks ideas
The TradingView Show: Charting Big Rotations with TradeStationOur discussion will dive into the breakout charts of small caps, the ongoing chatter about interest rates, and the shift among Fed members towards a dovish stance. We'll also examine the implications of the slowing AI stock boom and the increasing participation of stocks in catching a bid in the bro
Divergence: RSI vs. PriceHey everyone!
In my years of trading, I've really come to love Reversal Strategies and my favorite is in the form of a DIVERGENCE!
Today, I took some time to put together an Educational Video on:
1) What a Divergence Is?
2) How to Spot them!
&
3) How to Trade them!
I hope you find this helpful!
The Semiconductor Bubble is Finally PoppingI believe it is time for one of the biggest bubbles in history to be popped. I'm talking about semiconductors here, but really I would call this entire situation an "everything bubble." i think it all starts with semiconductors though, once the bubble pops it's going to get ugly quick and shorts wil
Why Using Charts Can Help You with Your TradingImagine you've decided to buy a particular stock. Your position starts to make money, and you're thrilled. But what do you do now? Should you hold onto your position or cash it in? Has it made enough profit, or will it go further? It's painful to lose money, but it's also frustrating to take profits
Gold Hits Record Highs! Skyrocket Further or Sharp Reversal?4-Hour Time Frame Analysis:
Higher Highs (HH) and Higher Lows (HL): The chart displays a clear upward trend with higher highs and higher lows. This indicates a bullish market structure.
Ascending Channel: The price is moving within an ascending channel, showing a steady increase in value.
Key Lev
BTCUSD - $63,000 - $65,000 Imminent... This weekend, i was expecting a selloff into $52,000 but wat happened was a low resistance liquidity run into premium arrays.
Looking at the daily order block array @ $63,866 as the first point of interest.
We also have a weekly array just above that area which spans upto FWB:65K
Gold analysis and trade idea 16 JulyConsolidation zone forming a bull flag pattern
Resistance area at 2449
Potential double top formation at 2445-50 level
Possibility of consolidation before breakout, with multiple attempts needed for a successful breakout
Buying opportunities seen for every dip within the channel
Resistance levels at

See all editors' picks ideas
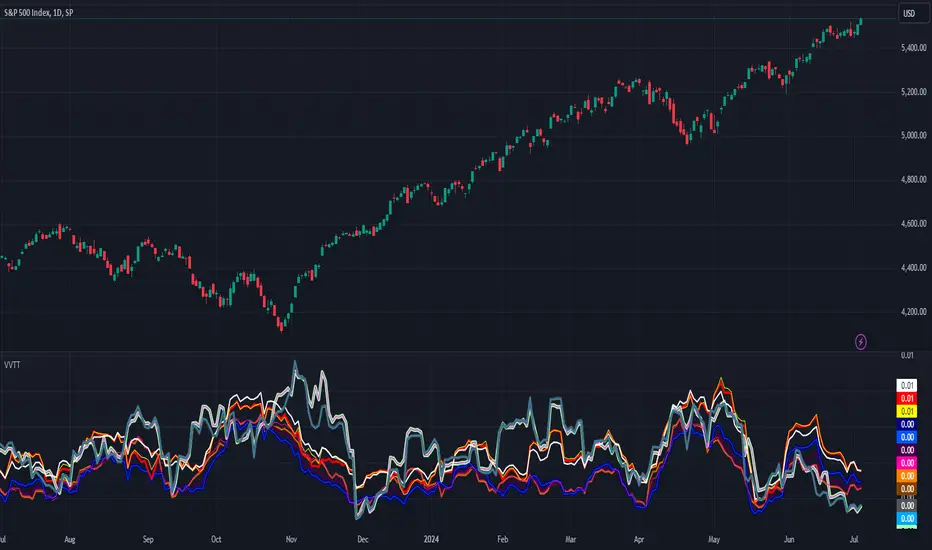
[Pandora] Vast Volatility Treasure TroveINTRODUCTION:
Volatility enthusiasts, prepare for VICTORY on this day of July 4th, 2024! This is my "Vast Volatility Treasure Trove," intended mostly for educational purposes, yet these functions will also exhibit versatility when combined with other algorithms to garner statistical excellence. Onc
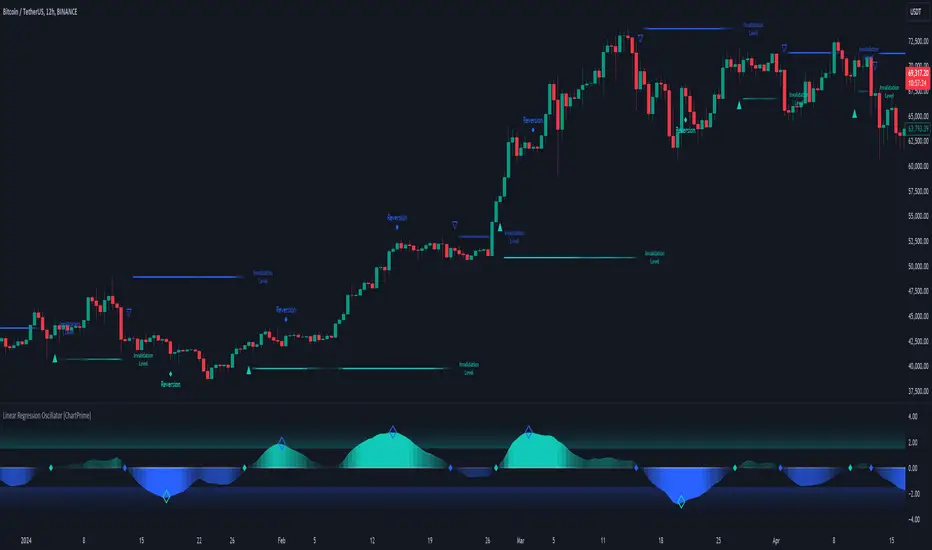
Linear Regression Oscillator [ChartPrime]Linear Regression Oscillator Indicator
Overview:
The Linear Regression Oscillator is a custom TradingView indicator designed to provide insights into potential mean reversion and trend conditions. By calculating a linear regression on the closing prices over a user-defined period, this oscillato
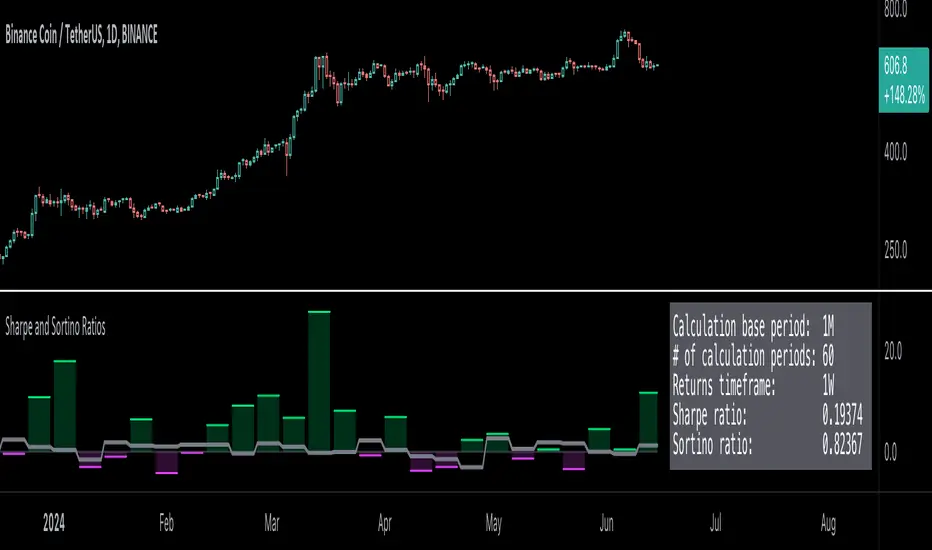
Sharpe and Sortino Ratios█ OVERVIEW
This indicator calculates the Sharpe and Sortino ratios using a chart symbol's periodic price returns, offering insights into the symbol's risk-adjusted performance. It features the option to calculate these ratios by comparing the periodic returns to a fixed annual rate of retur
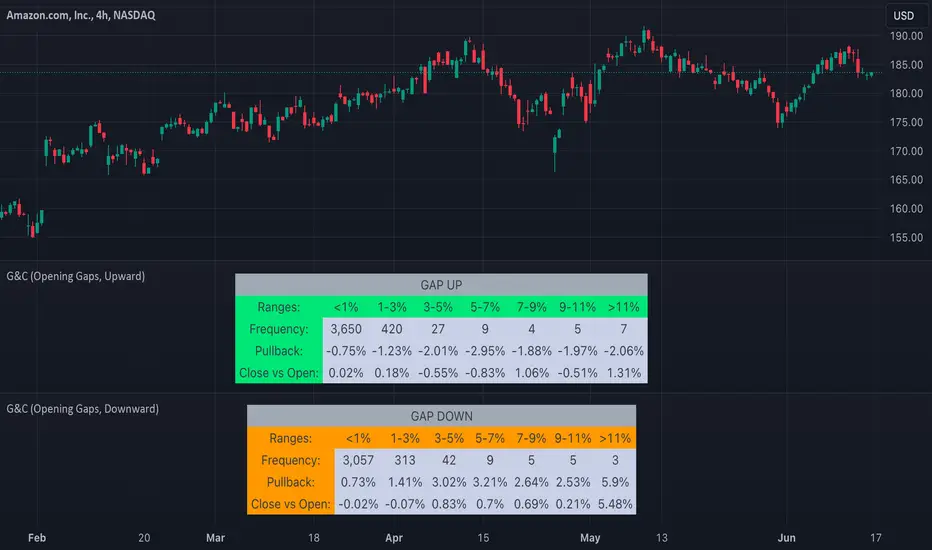
TASC 2024.07 Gaps and Extreme Closes█ OVERVIEW
This script, inspired by Perry Kaufman's article "Trading Opening Gaps and Extreme Closes in Stocks" from the TASC's July 2024 edition of Traders' Tips , provides analytical insights into stock price behaviors following significant price moves. The information about the frequency, pullb
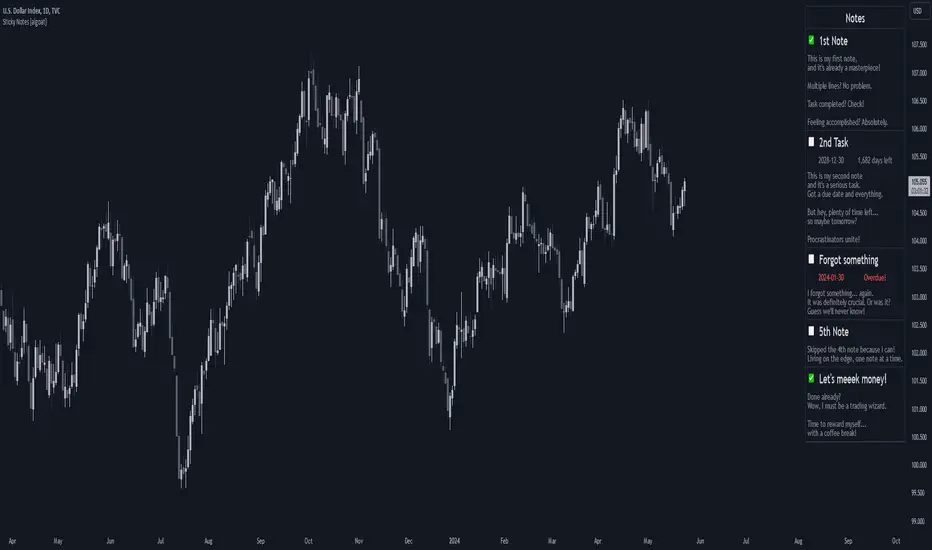
Sticky Notes, Checklist, To-do, Journal [algoat]I forgot to bring my notes again...
Ever feel like your trading notes are all over the place, much like your portfolio after a market dip? Worry not! With this script, you'll have all your trading notes, tasks, and brilliant (or not so brilliant) ideas neatly organized right on your chart. It's li
Ichimoku Theories [LuxAlgo]The Ichimoku Theories indicator is the most complete Ichimoku tool you will ever need. Four tools combined into one to harness all the power of Ichimoku Kinkō Hyō.
This tool features the following concepts based on the work of Goichi Hosoda:
Ichimoku Kinkō Hyō: Original Ichimoku indicator with

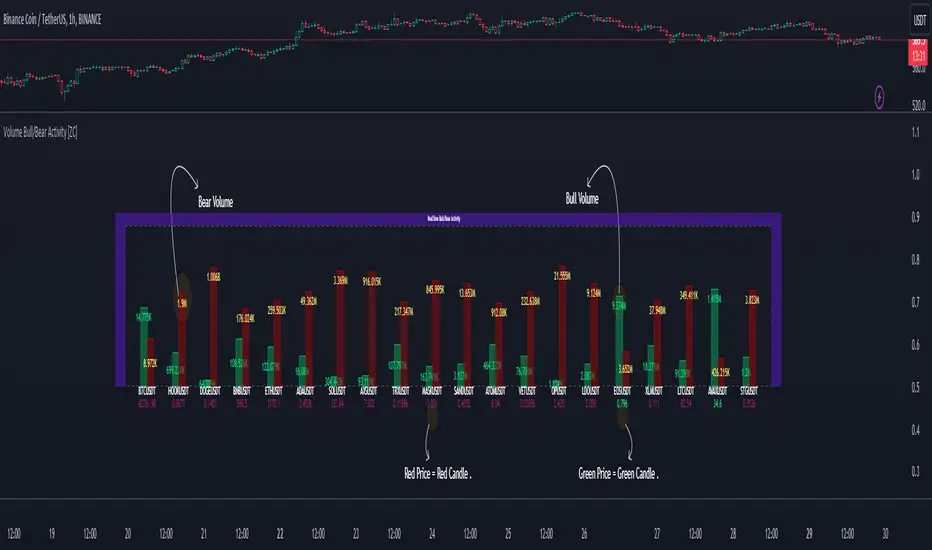
Volume Bull/Bear Activity [ZC]Volume Bull/Bear Activity Summary
This indicator generates a summary of bull/bear activity for 20 symbols.
For each symbol, two bars are displayed, colored green and red.
The green bar indicates bull volume, reflecting activity within the last candle of the symbol.
The red bar signifie
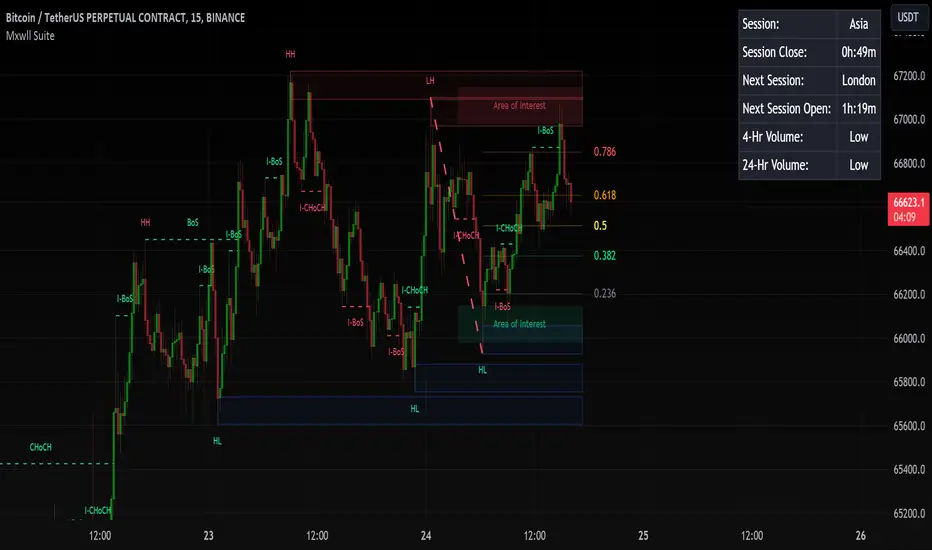
Mxwll Price Action Suite [Mxwll]Introducing the Mxwll Price Action Suite!
The Mxwll Price Action Suite is an all-in-one analysis indicator incorporating elements of SMC and also ideas extending beyond the trading methodology!
Features
Internal structures
External structures
Customizable Sensitivities
BoS/CHoCH
Order B
Percent Rank HistogramThis Pine script indicator is designed to create a visual representation of the percent rank for multiple financial instruments. Here's a breakdown of its key features:
Percent Rank Calculation:
The core functionality of this Pine script indicator revolves around the calculation of the percent r

Heat Map SeasonsHeat Map Seasons indicator
Indicator offers traders a unique perspective on market dynamics by visualizing seasonal trends and deviations from typical price behavior. By blending regression analysis with a color-coded heat map, this indicator highlights periods of heightened volatility and helps

See all editors' picks scripts