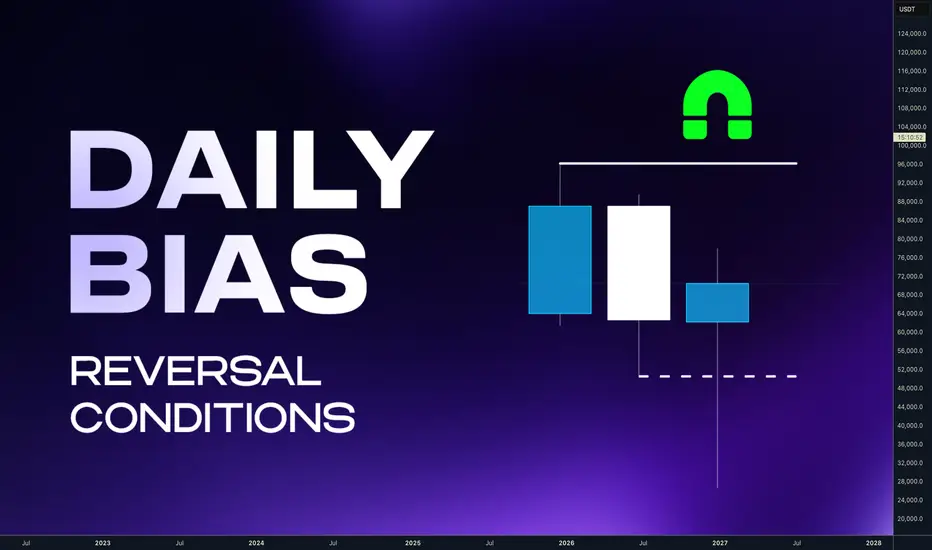
Easy Method to Spot and Trade ReversalHey whats up trader, in the last post we determined Daily Bias in the Trending conditions.
Now let's have a look to the reversal conditions.
We will look at the Daily bias, but as I mentioned this many times in my posts - price is fractal so you can use this at any timeframe. But, If I can give you recommendations look for Higher timeframe bias on Daily and Weekly and H4 / H1 Structure and M15 entries.
⁉️ Where is the liquidity ? Always follow the Daily / Weekly candle close.
Before I will show you my reversal pattern lets look first at how price stays in a trend.
📈 Continuation
If todays daily candle closed above previous days high and its still not reaching the key level, then liquidity is above todays high. Why ? Because people have intentions to sell highs to early, so and price will most likely go there. So we are bullish. Bullish Close 📈 Reversal
If todays candle wicked above previous day high, but closed below , then we can expect liquidity is below Previous days low. Why? Because mostl likely traders entered fake high break out they put SL below days low. It's signs of reversal. Every significant reversal wicked above / below Previous days high/ low and closed inside, if not seen on PDH then its on weekly. 🧩 Liquidity theory
Its always good to thing about the markets in terms of what others are doing. Back in 2014 when I worked in broker I had a chance to watch the order book. I have been able to see how traders are entering the markets where they put they stop losses. In the fact many people are chasing the price and they always buy highs and sell lows and most of the time they hide stop losses bellow / above the lows / highs of broken candle.
So if that is true, it can look like on the picture below. We can see price moving up. Focus on candles with the wick. It's what we see now. But at specific moment that candle was looking bullish and most likely traders entered with hope for the continuation. And they have put stop loss below the previous days lows. as that candle closed with the wick below the previous days high traders are now trapped in the longs and stop run against them starts now. It's our opportunity its our range - Our new bias.
Same it will be for the bullish case, traders sell the break out of the lows and put their stop loss above previous days highs. This behaviors creates a stop loss cluster there - which is liquidity and its high chance market will go there soon. Its our opportunity - our new bias So based on the candle closes we are able to defined a candle which was manipulated and its your range. I always markup range high / low and its 50% because its always a first target or partial profit when trading these ranges.
I have explained more about Range trading in this post 🔗Click the picture to learn more 👇https://www.tradingview.com/chart/BTCUSDT.P/PkQJvVm4-Complete-system-for-Day-Swing-Traders/ if you have read the linked post above you must understand that candle close are just a pattern.
‼️ We don't want to be just pattern traders, we need to understand the market context to filter out only high probability setups. Every setup must have following
1️⃣Key Level
our pattern without a key level is nothing. You dont want to be pattern trader, we need to add market context so every trade must go from a key level. Key levels occurs above / Below the ranges 2️⃣ Liquidity
Every range or range manipulation has to go above old highs / lows. Its increase the probability that traders entered break out so we can trade against them 3️⃣ Range definition
Skip small ranges. Not only that they will not give you proper risk to reward ratio, but they didnt created fomo or panic. We want see violent big range candles. Again go thru the charts you will see that big volatility always occurs before the reversal. 4️⃣Multiple timeframe ranges
for higher probability and biggest risk to reward setups mix HTF range with LTF ranges as for example on the chart below we can see Monthly, Weekly ranges, and even Daily range on the lows. There was H1 entry on the daily. And we closed above previous day = Daily order block on the edge of the Monthly and Weekly range = It will most likely go higher
✍️ Homework
its not point to show you how many times these ranges works or not. You can look to my profile and you will see many successful trades and also unsuccessful ones. Yes there is also losses. We are humans and we make mistakes. So forget about holy grail, but if you want to learn something there is no better way to learn than on live examples.
Here are charts with current ranges im seeing. With my Bias for the next week.
Go to your charts, find them and observe how the price action will develop. Might you find something to your trading arsenal.
🧪 DOLLAR- Monthly CLS range I Weekly CLS Range 🧪 GBPUSD - Monthly CLS range & Weekly CLS range 🧪 EURUSD - Monthly CLS range & Weekly CLS range 🧪 USDCHF - Monthly CLS range & Weekly CLS range Adapt useful, rejects useless ...
Thanks for readying. Have a great trading week.
David Perk aka Dave FX Hunter
Community ideas
EUR/USD – H4 Wedge Pattern | Dollar Weakness & Fed Cut Bets🧠 Setup Overview:
EUR/USD is forming a falling wedge pattern on the H4 chart — a potential bullish reversal structure after weeks of downside pressure. The pair is testing the upper wedge trendline, suggesting a possible breakout, but confirmation is still pending. FX:EURUSD
📊 Trading Plan: ✅ Bullish Scenario:
🟢Watch for a confirmed breakout above the wedge and cloud resistance zone.
🟢If confirmed, expect a move toward 1.1730 (1st Resistance) and 1.1800 (2nd Resistance).
⚙️ Technical Levels:
🟢 1st Resistance: 1.1732
🟢 2nd Resistance: 1.1804
🔴 Support Zone: 1.1500 – 1.1470
🧩 Fundamental Updates (Today – 9 Nov 2025):
1️⃣ U.S. Treasury yields slipped slightly as surveys showed weaker consumer confidence, softening the dollar’s tone.
2️⃣ Fed rate cut expectations increased — markets now price a 66% chance of a 25 bps cut in December, according to CME FedWatch.
3️⃣ Government funding worries: renewed concerns over a potential U.S. government shutdown weighed on sentiment and limited USD demand.
🔴These factors combined create short-term bearish pressure on USD, which may fuel a EUR/USD rebound if momentum sustains above the wedge.🔴
#EURUSD #Forex #PriceAction #TechnicalAnalysis #ChartPattern #FallingWedge
#FundamentalAnalysis #FedWatch #USD #EUR #ForexSignals #KABHI_TA_TRADING #ChartsDontLieTradersDontQuit #SwingTrading #ForexEducation #FXMarket #TradingView
⚠️ Disclaimer:
This post is for educational purposes only — not financial advice. Always perform your own analysis and manage risk carefully before entering trades.
💬 Support My Work ❤️
If you like this analysis — drop a LIKE 👍, leave a COMMENT 💭, and FOLLOW 🔔 to stay updated with more Forex setups, price action insights, and live market fundamentals!

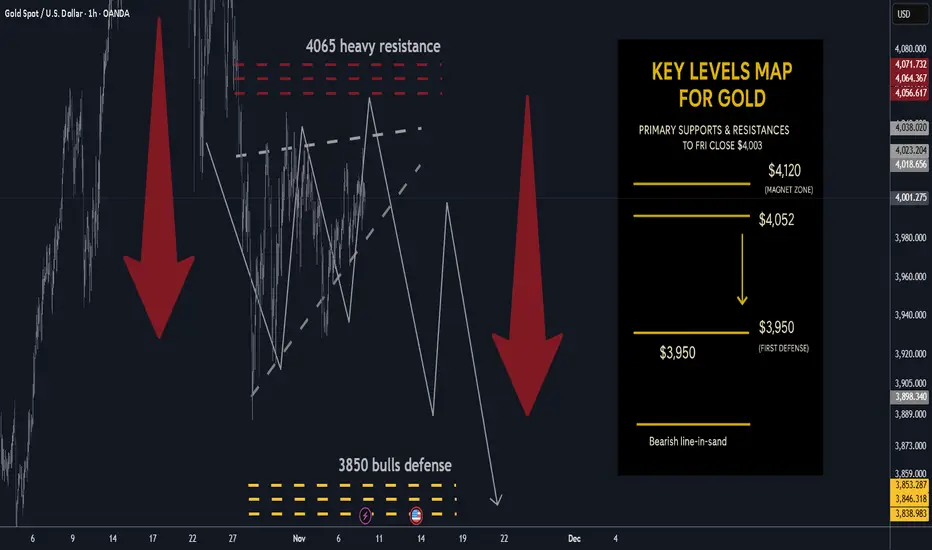
Gold next week: Key S/R Levels and Outlook for Traders🔥 GOLD WEEKLY SNAPSHOT — BY PROJECTSYNDICATE
🏆 High/Close: $4,024.9 → ~$4,003 — sellers faded upticks; weekly close soft but back above the round $4k.
📈 Trend: Neutral / mild correction inside range; not expecting immediate new highs while <$4,080–4,120.
🛡 Supports: $3,950 → $3,900 → $3,850 — pivotal shelves for bears’ take-profit and control.
🚧 Resistances: $4,040 / $4,080 / $4,120 — repeated supply zones; first taps favored for fades.
🧭 Bias next week: Short sells into $4,040–$4,120; TP $3,950 then $3,850 (your plan). Invalidation on sustained reclaim > $4,120–$4,175; loss of $3,850 risks extension lower.
🌍 Macro tailwinds/headwinds (this week’s tape):
• Narrative tone: Kitco flagged “razor’s edge” near $4,000 with mixed views (bubble vs. consolidation), while another Kitco piece framed the stall as a “healthy pause.”
• WSJ flow: Headlines oscillated between “slips below $4,000” and modest up-days; net read is consolidation around $4k with quick two-way trade.
• Levels: Spot finished the week essentially on $4k; intrawEEK high couldn’t clear early-week $4.02–4.03k cap.
🎯 Street view: After last month’s print above $4,000 (first ever), WSJ tone shifted to digestion; rallies still attract supply until a decisive reclaim of upper resistance.
________________________________________
🔝 Key Resistance Zones
• $4,040 — immediate ceiling; weekly high proximity, likely to cap first tests.
• $4,080 — secondary supply ledge from recent failures.
• $4,120 — upper band; acceptance above here starts to neutralize the correction.
🛡 Support Zones
• $3,950 — first defense / first TP.
• $3,900 — round-number shelf; loss invites momentum probes.
• $3,850 — critical structural base and second TP; break risks downside acceleration.
________________________________________
⚖️ Base Case Scenario
Compression within a rising-wedge-like structure, ranging $3,850–$4,120. First pushes into $4,040–$4,120 are sellable for rotations toward $3,950 → $3,850 while the market respects weekly lower highs.
🚀 Breakout / Breakdown Triggers
• Bull trigger: Sustained acceptance > ~$4,120–$4,175 turns the tone constructive again and reopens $4,200+.
• Bear trigger: Daily close < $3,900 increases odds of full $3,850 test; failure of $3,850 risks momentum spill.
💡 Market Drivers to watch
• Fed path / real yields (rate-cut odds vs. sticky inflation narrative in WSJ copy).
• USD swings (no broad USD weakness → upside attempts stall).
• ETF/CB flows (Kitco interviews highlight split sentiment; dip-buyers active, momentum players cautious).
• Event risk (headline sensitivity remains high; quick squeezes into resistance possible).
🔓 Bull / Bear Trigger Lines
• Bullish above: $4,120–$4,175 (sustained).
• Bearish below: $3,900 → $3,850 (risk expands under $3,850).
🧭 Strategy for this week
Short from resistance: Scale in around $4,040 → $4,080 → $4,120;
TP #1: $3,950; TP #2: $3,850;
Risk: Hard stop on a daily close above $4,120 (or intraday breach that holds on retest). Consider trimming if a news-driven squeeze tags $4,175 and fails.
Lingrid | GOLD Weekly Market Outlook: Sell the SpikesOANDA:XAUUSD parabolic October rally has stalled, giving way to a sharp corrective phase. This signals waning momentum and the potential start of a deeper pullback. With price now testing key support near $4,000, the market is at a critical juncture: failure to hold this zone opens the door to targets at $3,890 and potentially $3,850.
The 4H structure reinforces the bearish bias, as price bounces into a descending trendline acting as dynamic resistance. Any rally toward the $4,050–$4,100 zone is likely a shorting opportunity, not a bullish reversal. This area aligns with the 1.272 Fibonacci extension of the recent swing. A decisive break below $3,950 would confirm bearish continuation and likely accelerate selling pressure following channel breakout.
Fundamentally, uncertainty surrounding the US government shutdown continues to fuel risk-off sentiment, supporting the dollar and pressuring gold. Possibly, this corrective phase will persist until the shutdown threat is resolved. Until then, the path of least resistance remains down. We should avoid chasing rebounds and instead focus on disciplined short entries on rallies, with tight risk controls. The bull isn’t dead—but for now, it seems the bears are in charge.
If this idea resonates with you or you have your own opinion, traders, hit the comments. I’m excited to read your thoughts!

GOLD → Gold within the trading range...FX:XAUUSD is consolidating amid a pullback in the dollar and in anticipation of stronger key data as a driver for movement. Focus on the current trading range
On Friday, before the close of the session, the market formed a short squeeze, a strange volatility without news. It is important to monitor the Asian and European sessions and price behavior within the current trading range.
Earlier, we saw the dollar rise along with gold, indicating the strength of the metal and interest from the bulls. Let's assume that this situation has not yet run its course. In that case, after Friday's short squeeze, I expect MM to test liquidity in the 3985-3964 zone before a possible attempt to grow. Support from the upward channel may also affect the price. I still consider 4030 to be an important resistance level. If the bulls manage to break this barrier and keep the price above this level, gold will be able to end its correction and move into a growth phase. Otherwise, the market will tend to break out of the current consolidation downwards...
Resistance levels: 4020, 4030 - 4050
Support levels: 3985, 3963, 3931
Technically, while the price is within the trading range, it is worth considering trading relative to its boundaries. The fundamental background during the weekend is difficult to assess, so we will need to watch the situation during the European session...
Best regards, R. Linda!

Bitcoin: 100K NOW Attractive For Investing.Bitcoin looks bearish to most, I can understand why BUT as bearish as this looks, the current price area still presents a potential area for a bullish reversal. The 98K low dates back to the June low which is now acting as the support. IF this level breaks, 95K is the next inflection point to watch for a swing trade long possibility. IF that is cleared, 90K becomes the level. The 88K AREA is the Wave 1 overlap WHICH MEANS: IF price tests this area and does not reject it quickly, that would confirm that Bitcoin is most likely in the BROADER corrective wave that I was talking about earlier in the year.
What I have just laid out here is a number of scenarios that may or may not unfold. The purpose is to be prepared for a market scenario and have a plan in case a confirmation appears. There is NO way to accurately forecast this. I evaluate price structures, and change my outlook based on changes or lack of changes in price structure. From this point I can gauge potential BUT require confirmations to gauge RISK. The illustration on this chart show the bounce scenarios that I am looking for this week which can take price back into the 105K AREA which is now an old support / NEW resistance.
The 100K area is also a MUCH more attractive location for investing, especially compared to the 125K AREA high. Keep in mind, as an INVESTOR, you assume the greatest risk. This means you must be open to the possibility of Bitcoin testing low 80Ks or even the 70Ks in the coming months. While I do believe this is a lower probability at this point, it CAN happen. As an investor you control risk with size that is proportional to your account and minimal or NO use of leverage for this precise reason.
I don't care why Bitcoin is weak now because fundamentally, not much has changed in terms of an inflationary environment. News is for content producers and frauds to monetize your attention. If it had any actionable value, they should have been calling the top at 126K instead of over reacting to it. This is why I rely on wave counts to guide my broader view of how Bitcoin is likely to behave in the near future. And also why I believe the broader bullish structure (Wave 4) is still intact until price overlaps Wave 1 at 88K. IF this level cannot be tested within this bearish attempt, it implies a broader Wave 5 is likely to follow which theoretically can see a test of the 126K high. The Federal Reserve's easing policy aligns with this scenario as well. We are also facing an information gap in the form of missing governments reports which can have a major affect, just something to think about.
Thank you for considering my analysis and perspective.

BTCUSD Tests Buyer Zone — Eyes Break Below $100KHello traders, here’s my current outlook on Bitcoin (BTCUSD). The market continues to trade within a broader bearish structure after breaking down from the previous rising channel. The price failed to hold above the $110,000–$111,000 Seller Zone, where multiple fake breakouts occurred, indicating strong bearish pressure and aggressive selling activity in that region. After the rejection from the Seller Zone, BTC shifted into a descending trend structure, forming lower highs along a clearly defined Resistance Trendline. Each corrective move to the upside has been capped by this trendline, confirming that sellers are maintaining control. Meanwhile, the Support Level around $100,200–$101,000 has acted as a key Buyer Zone, where price has repeatedly paused and reacted, suggesting that buyers are attempting to absorb selling pressure here. Currently, BTC is consolidating just above this Support Zone, but the overall momentum remains bearish. If the price fails to break above the descending Resistance Line, we could see a continuation of the downtrend, likely pushing toward a retest of the $100,200 Support Level. A confirmed breakdown below this level would expose the next downside support levels and reinforce the sellers’ dominance. However, if buyers manage to hold the price above $100,200 and force a breakout above the descending Resistance Line, a short-term corrective recovery could unfold toward the $103,000–$105,000 region. This area remains critical and is likely where sellers may look to re-enter the market based on previous reaction structure. For now, the market structure favors a bearish bias, with the trend down and sellers maintaining stronger control. I am watching for a reaction at the current support — if the level breaks, continuation lower becomes the primary expectation. Please share this idea with your friends and click Boost 🚀

USD/JPY - Wedge Breakdown |Watch 150.00 & 148.00✅ USD/JPY Analysis – H4 Chart - Rising Wedge Breakdown Potential
Price is currently respecting a Rising Wedge structure, showing signs of exhaustion near the Key Zone (≈154.20–154.70). We’ve seen a break + minor retest, indicating possible bearish continuation if sellers maintain pressure.
A drop toward the Psychological Level – 150.00 remains likely, followed by a deeper move into the 148.00 Key Zone if momentum continues.
✅ Market Context:
1️⃣Downward structure building inside the pattern.
2️⃣Sellers are showing strength near support levels.
3️⃣Breakdown below the trendline indicates momentum continuation toward lower zones.
✅ Trade Plan:
Entry: Sell after confirmed breakdown below the support (Candle close below trendline or retest of the breakout).
💰Take Profit (TP): At the Key Zone – major support area identified ahead.
🛑Stop Loss (SL): Above the pattern structure / recent swing high.
✅Psychological Discipline:
1️⃣Stick to plan – No Revenge Trades.
2️⃣Accept losing trades as part of the strategy.
3️⃣Risk only 1–2% of your account balance per trade.
✅ Support this analysis with a
LIKE 👍 | COMMENT 💬 | FOLLOW 🔔
It helps a lot & keeps the ideas coming!
⚠️ Disclaimer: This analysis is for educational purposes only and does not constitute financial advice. Forex trading involves high risk. Trade only with capital you can afford to lose and always do your own research.

BTC Preparing for the Next Parabolic Phase Patience Is KeyBitcoin continues to respect its macro bullish structure, maintaining a firm stance above both the Critical and Immediate Demand Zones. The recent consolidation is acting as a natural pause within the broader uptrend a healthy retest phase rather than a reversal.
The $92k–$101k zone remains the immediate area of interest, where we expect buyers to regain dominance if tested. Sustaining above this structure keeps the market aligned for another expansion wave targeting $142k–$190k, with the final projection extending toward the $297k region in the next major bullish leg.
As long as price holds above the defined demand areas, the long-term outlook remains decisively bullish. Corrections within this channel are accumulation opportunities, not signs of weakness.

GOLD DAILY CHART ROUTE MAPHey everyone,
Please review our Daily Chart Route Map, now featuring updated levels for tracking Golds movement.
We continue to track our refreshed proprietary Goldturn Channel, our unique method for constructing ascending channels. Price action is now testing the swing range and the swing range seems to be holding support as expected. This swing range support also falls inline with the channel half line providing stronger support.
As long as ema5 remains above the swing zone we expect price to play between this range until the full updated long term swing is completed into 4145. An ema5 break below the swing range will open the lower channel floor for test, currently sitting at 3824
As always, we will keep you all updated with regular updates throughout the week and how we manage the active ideas and setups. Thank you all for your likes, comments and follows, we really appreciate it!
Mr Gold
GoldViewFX

XAUUSDHello Traders! 👋
What are your thoughts on Gold?
The $3,900 level continues to act as a key support zone for gold, preventing further downside pressure for now.
Currently, the price is consolidating between the highlighted support and resistance levels, showing range-bound behavior in the short term.
We expect gold to form a short-term upward correction toward the resistance zone, followed by a bearish rejection from that level.
If price fails to hold above $3,900 zone and breaks below the support, a deeper decline toward lower levels could follow.
As long as the $3,900 support holds, gold is likely to remain in a sideways structure, but a confirmed breakdown would signal the start of a new bearish leg.
Don’t forget to like and share your thoughts in the comments! ❤️

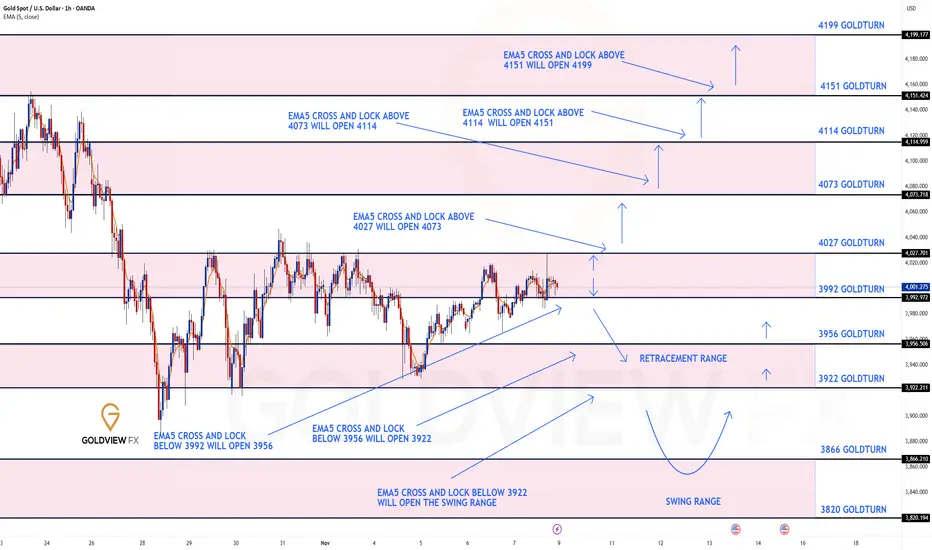
GOLD 1H CHART ROUTE MAP UPDATE & TRADING PLAN FOR THE WEEKHey Everyone,
Please see our updated 1h chart levels and targets for the coming week.
We are seeing price play between two weighted levels with a gap above at 4027 and a gap below at 3992. We will need to see ema5 cross and lock on either weighted level to determine the next range.
We will see levels tested side by side until one of the weighted levels break and lock to confirm direction for the next range.
We will keep the above in mind when taking buys from dips. Our updated levels and weighted levels will allow us to track the movement down and then catch bounces up.
We will continue to buy dips using our support levels taking 20 to 40 pips. As stated before each of our level structures give 20 to 40 pip bounces, which is enough for a nice entry and exit. If you back test the levels we shared every week for the past 24 months, you can see how effectively they were used to trade with or against short/mid term swings and trends.
The swing range give bigger bounces then our weighted levels that's the difference between weighted levels and swing ranges.
BULLISH TARGET
4027
EMA5 CROSS AND LOCK ABOVE 4027 WILL OPEN THE FOLLOWING BULLISH TARGETS
4073
EMA5 CROSS AND LOCK ABOVE 4073 WILL OPEN THE FOLLOWING BULLISH TARGET
4114
EMA5 CROSS AND LOCK ABOVE 4114 WILL OPEN THE FOLLOWING BULLISH TARGET
4151
EMA5 CROSS AND LOCK ABOVE 4151 WILL OPEN THE FOLLOWING BULLISH TARGET
4199
BEARISH TARGETS
3992
EMA5 CROSS AND LOCK BELOW 3992 WILL OPEN THE FOLLOWING BEARISH TARGET
3956
EMA5 CROSS AND LOCK BELOW 3956 WILL OPEN THE FOLLOWING BEARISH TARGET
3922
EMA5 CROSS AND LOCK BELOW 3922 WILL OPEN THE SWING RANGE
3866
3820
As always, we will keep you all updated with regular updates throughout the week and how we manage the active ideas and setups. Thank you all for your likes, comments and follows, we really appreciate it!
Mr Gold
GoldViewFX
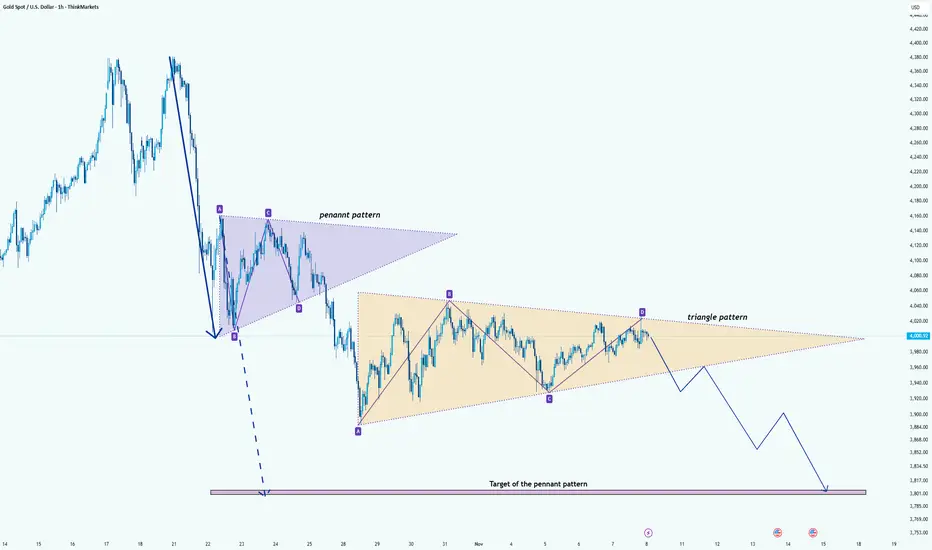
Gold (XAUUSD): Triangle Compression After Pennant BreakHi!
After the strong, impulsive drop, Gold formed a bearish pennant, which has already broken to the downside. The measured move target of that pennant remains unfilled, and the price continues to consolidate below the breakdown point.
Currently, the market structure is developing inside a symmetrical triangle, showing compression and reduced volatility. This type of structure often acts as a continuation pattern when it forms after an impulsive leg, especially when positioned below the previous pennant.
The projection highlights the expectation of a downside breakout from the triangle, with a gradual sell-off into the next liquidity pocket. The ultimate target aligns with the remaining pennant target zone, which also coincides with a prior demand level.
As long as the price remains inside this tightening structure and below point D, the bearish continuation scenario stays valid.
Target: $3811
Disclaimer: As part of ThinkMarkets’ Influencer Program, I am sponsored to share and publish their charts in my analysis.
GOLD 4H CHART ROUTE MAP UPDATE & TRADING PLAN FOR THE WEEKHey Everyone,
Please see our updated 4h chart levels and targets for the coming week.
We are seeing price play between two weighted levels with a gap above at 4042 and a gap below at 3964. We will need to see ema5 cross and lock on either weighted level to determine the next range.
We will see levels tested side by side until one of the weighted levels break and lock to confirm direction for the next range.
We will keep the above in mind when taking buys from dips. Our updated levels and weighted levels will allow us to track the movement down and then catch bounces up.
We will continue to buy dips using our support levels taking 20 to 40 pips. As stated before each of our level structures give 20 to 40 pip bounces, which is enough for a nice entry and exit. If you back test the levels we shared every week for the past 24 months, you can see how effectively they were used to trade with or against short/mid term swings and trends.
The swing range give bigger bounces then our weighted levels that's the difference between weighted levels and swing ranges.
BULLISH TARGET
4042
EMA5 CROSS AND LOCK ABOVE 4042 WILL OPEN THE FOLLOWING BULLISH TARGETS
4147
EMA5 CROSS AND LOCK ABOVE 4147 WILL OPEN THE FOLLOWING BULLISH TARGET
4264
EMA5 CROSS AND LOCK ABOVE 4264 WILL OPEN THE FOLLOWING BULLISH TARGET
4340
EMA5 CROSS AND LOCK ABOVE 4340 WILL OPEN THE FOLLOWING BULLISH TARGET
4422
EMA5 CROSS AND LOCK ABOVE 4422 WILL OPEN THE FOLLOWING BULLISH TARGET
4494
BEARISH TARGETS
3964
EMA5 CROSS AND LOCK BELOW 3964 WILL OPEN THE FOLLOWING BEARISH TARGET
3873
EMA5 CROSS AND LOCK BELOW 3873 WILL OPEN THE SWING RANGE
3741
3632
As always, we will keep you all updated with regular updates throughout the week and how we manage the active ideas and setups. Thank you all for your likes, comments and follows, we really appreciate it!
Mr Gold
GoldViewFX

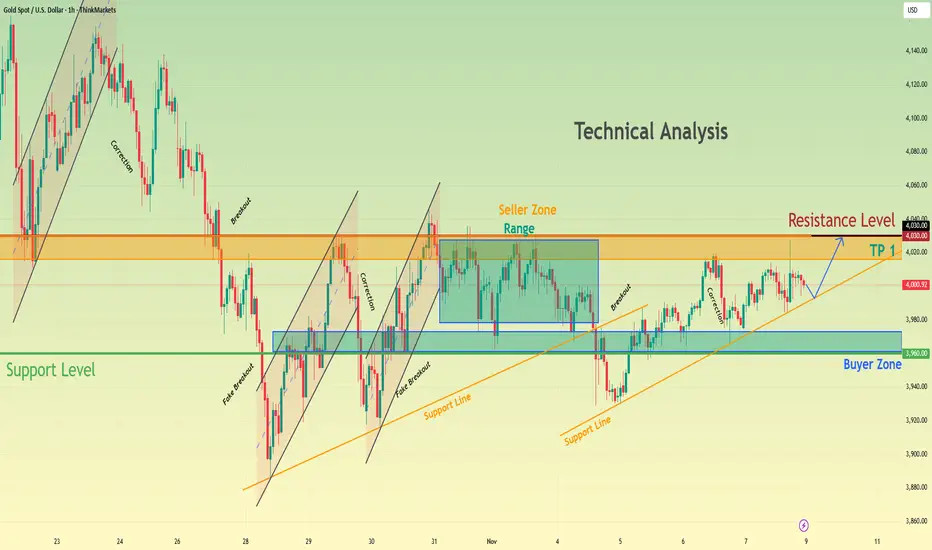
XAUUSD Holds Buyer Zone — Potential Recovery Toward $4,030Hello traders, I’d like to share my view on Gold (XAUUSD). The market has been holding a constructive bullish structure, developing higher lows along the rising Support Line. Each time price approached this trendline, buyers reacted strongly, confirming persistent demand. Meanwhile, the $3,960–$3,980 Buyer Zone has acted as a key accumulation area, where several fake breakouts occurred, but price quickly returned back above support — indicating seller failure and liquidity sweeps before bullish continuation. On the upper side, we have a clear Resistance Level and Seller Zone near $4,020–$4,040, where the market previously consolidated inside a range. Multiple rejections were seen in this zone, suggesting that sellers are active here and this remains the next significant reaction area for price. Recently, Gold has been gradually moving upward from the buyer zone, forming a steady corrective climb inside the current structure. At this stage, the trend remains bullish while price stays above the ascending Support Line and Buyer Zone. The immediate objective for buyers is a retest of the $4,020–$4,030 Resistance Level, where price may react again based on previous market behavior. A confirmed breakout above this zone would open the way for further continuation, while rejection could lead to another pullback into the support structure. Please share this idea with your friends and click Boost 🚀
Bitcoin Faces Rejection — Targeting 101,300 SupportBitcoin (BTC/USD) is showing a potential bearish setup around the 103,000 level, with resistance near 104,500. A pullback is expected, targeting the 101,300 support area for a possible short-term decline.
Title: Bitcoin Bearish Rejection Toward 101,300 Target

BTCUSD: Bulls Eye Recovery Toward $104K Resistance ZoneHello everyone, here is my breakdown of the current Bitcoin setup.
Market Analysis
BTCUSD is currently showing signs of a potential bullish recovery after bouncing from the key $100,600–$101,200 Support Zone, which aligns with the Wedge Support Line on the chart. This area has acted as a Buyer Zone multiple times in the past, with each test triggering strong upward reactions. The recent fake breakouts below support suggest liquidity sweeps and show that sellers have been unable to sustain momentum to the downside.
Currently, price was moving within a falling wedge structure, reflecting a controlled corrective decline. Throughout this move, several fake breakouts occurred along both boundaries of the wedge, indicating seller exhaustion and possible accumulation by larger buyers. After touching the Support Zone again, BTCUSD formed a bullish reaction, signaling a shift from selling pressure to buying interest. BTCUSD is now approaching the $103,500–$105,000 Resistance Zone, which previously acted as a strong supply level where corrective upswings were rejected. This zone also aligns with the Wedge Resistance Line, making it a key decision area for the next directional move. If buyers can sustain momentum above support, the market may set up for a continued bullish recovery.
My Scenario & Strategy
As long as BTCUSD holds above the $100,600–$101,200 Support Zone, the bullish recovery outlook remains intact. I expect price to continue moving gradually higher toward the $103,500–$105,000 Resistance Zone as the next key target. A confirmed breakout above $105,000 and sustained holding would signal a shift in structure, potentially opening the path toward $110,000 in the medium term.
However, if price breaks back below the Support Zone, the bullish setup becomes invalid and BTCUSD may revisit deeper support levels before any new recovery attempt develops. For now, structure favors bullish continuation, and pullback-based long entries remain the most favorable approach while support holds.
That's the setup I'm tracking. Thank you for your attention, and always manage your risk.

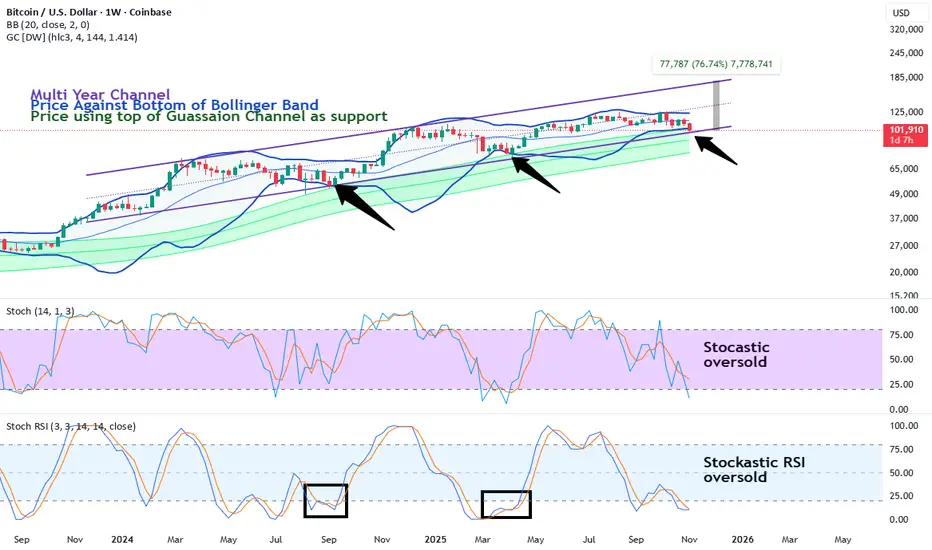
People Panic (again) as bitcoin returns to support (again)Bitcoin has been channeling up for about a year pretty consistently. The basic technical supports are still working. Price hits the weekly Bollinger band bottom, wicks through, builds structure and reverses to a new high. Price has also been bouncing off the top of the weekly gaussian channel. That's very optimistic as well.
So, these ideas main point is the "Trend is your friend until the end." What has really changed? Global liquidity is still going up. The various fiat currencies are being debased. Anti-fiat hedges like silver and gold are making all-time highs.
In a bull market you buy the dip and sell the rip. This is the dip. The rip is over 70% away at $175k. None of this means get reckless. We still have trendlines on lower time frames and lots of potential chop that can occur. There isn't a clear reversal pattern yet. BTC could make a inverted head and shoulders, a double bottom, all sorts of potential nonsense.
And lets be upfront, the channel could break down. Price could go from the top of the Gaussian channel to the bottom, etc. But so far my bias is continuation. Entries are going to be sought out on the daily and 3 day charts. Alts showed a lot of strength recently.
Others.d/bitcoin looks very bullish here at support. I expect it to chop up the next year quite well.
Others/eth has a double bottom.
Bitcoin is stabilized. Alts are basing out against bitcoin and eth. Finally. This is a great time to go long. Have a strategy. Layer a portfolio. All that stuff I can't actually advise you to do because I am not a financial advisor. I just share why I'm personally going long on crypto.
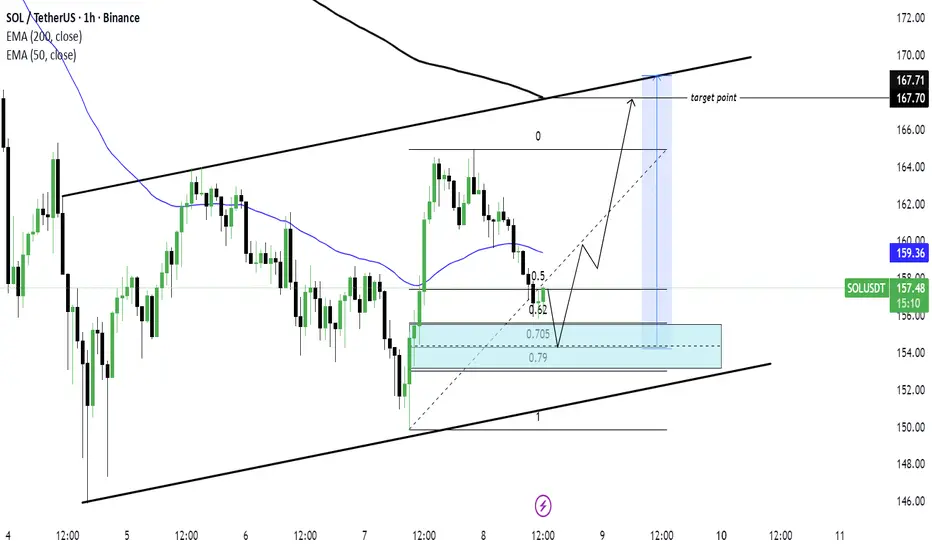
SOL/USDT) Bullish trend analysis Read The captionSMC Trading point update
Technical analysis of SOL/USDT (1-hour timeframe) — a potential continuation move within an ascending channel.
Here’s the complete breakdown
---
1. Market Structure
Price is moving inside a rising channel, confirming a bullish structure with higher highs and higher lows.
The two black trendlines outline this ascending pattern, indicating overall upward momentum.
---
2. Key Zone (Demand Area)
The blue box marks a demand or buy zone around $154–$155.5, aligned with the Fibonacci retracement levels (0.62–0.79).
This zone represents a potential retracement area where buyers may step in to continue the uptrend.
---
3. EMAs as Dynamic Support/Resistance
50 EMA (blue line) = $159.36
200 EMA (black line) = $167.71
Price is currently below the 50 EMA but still above the mid-channel trendline, suggesting temporary correction before continuation.
Once SOL bounces from the demand zone, reclaiming the 50 EMA would confirm momentum shift back to bullish.
---
4. Expected Move
The chart projects a short-term pullback into the demand zone (0.705–0.79 retracement).
From there, a bullish reversal is expected, leading to a continuation toward the upper boundary of the channel.
Target point: Around $167.7, matching the 200 EMA and channel resistance.
---
5. Summary
Trend: Bullish (ascending channel)
Bias: Buy the dip / Continuation upward
Entry Zone: $154 – $155.5 (blue demand zone)
Target: $167 – $168
Invalidation: Break below channel support (~$150)
---
Trading Idea Summary:
“SOL remains in a bullish channel. Price is retracing toward the 0.705–0.79 Fibonacci demand zone, where buyers are likely to re-enter. A bounce from this area could trigger a continuation move toward the $167 resistance zone.”
---
please support boost 🚀 this analysis
XAUUSD: Gold $3500 NextGold currently trading at a very key level from where we think price can reverse, there are three targets if the trade setup get activated. Remember to risk appropriately based on your own risk management. If you like our idea then do consider liking and commeting it means a lot to us.
For further information, please read the chart thoroughly which will give you better idea.
good luck
Team Setupsfx_

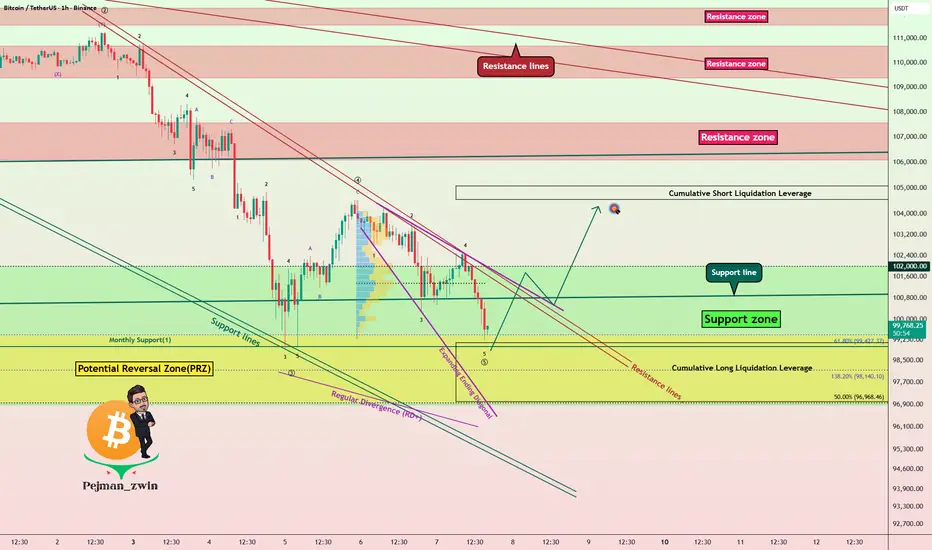
Bitcoin Bulls Defending $97K – Reversal Loading!Before diving into the Bitcoin analysis , it’s worth noting that Bitcoin has had a strong correlation with the SPX500 index ( SP:SPX ) in recent weeks. So, alongside analyzing Bitcoin, it’s a good idea to keep an eye on the SPX500 chart these days.
Currently, Bitcoin( BINANCE:BTCUSDT ) is moving in a Support zone($10200,980-$96,880) near a Potential Reversal Zone(PRZ) and a Cumulative Long Liquidation Leverage($99,145-$97,208) .
From an Elliott Wave perspective, it looks like Bitcoin is forming an Expanding Ending Diagonal to complete the microwave 5 of the main wave 5 .
Also, we can see a Regular Divergence(RD+) , which is a good sign of a potential reversal.
Given my expectation that the SPX500 Index will start to rise again, I also expect that Bitcoin will follow suit and could climb at least to around $104,200 .
Cumulative Short Liquidation Leverage: $105,074-$104,551
Stop Loss: $96,178
Please respect each other's ideas and express them politely if you agree or disagree.
Bitcoin Analysis (BTCUSDT), 1-hour time frame.
Be sure to follow the updated ideas.
Do not forget to put a Stop loss for your positions (For every position you want to open).
Please follow your strategy and updates; this is just my Idea, and I will gladly see your ideas in this post.
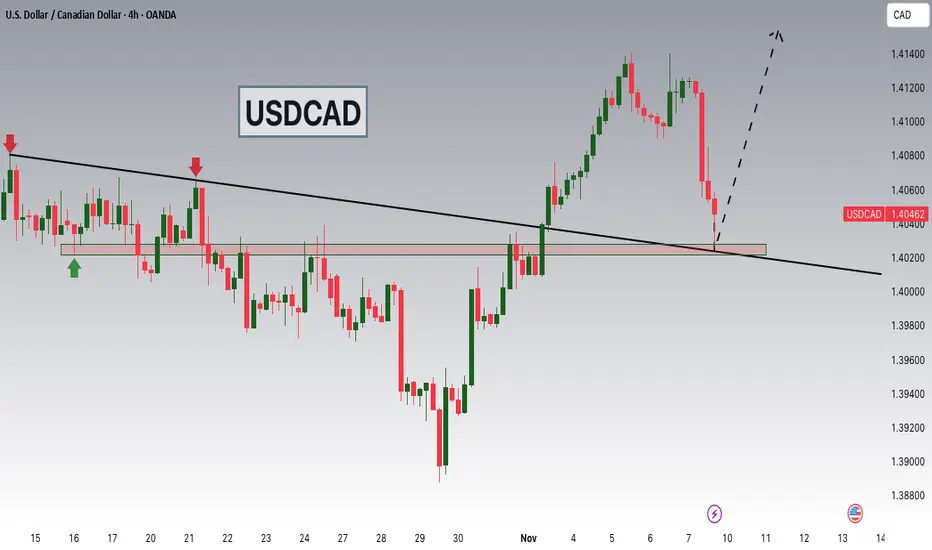
USDCAD Breakout and Potential RetraceHey Traders, in tomorrow's trading session we are monitoring USDCAD for a buying opportunity around 1.40250 zone, USDCAD was trading in a downtrend and successfully managed to break it out. Currently is in a correction phase in which it is approaching the retrace area at 1.40250 support and resistance area.
Trade safe, Joe.
BTCUSDT(BITCOIN): Bitcoin is bearish for now at least! Bitcoin is in distribution phase if we using the smart money concept, that is why we think price is at the final point before it drop faster. There will be mixed views regarding the bitcoin, but this is our personal view and which is more likely view compare to buying. Please use accurate risk management while trading bitcoin. This setup may take time to get it completed, and we will keep you guys updated.
Good luck and trade safe!
Team Setupsfx_
